Research
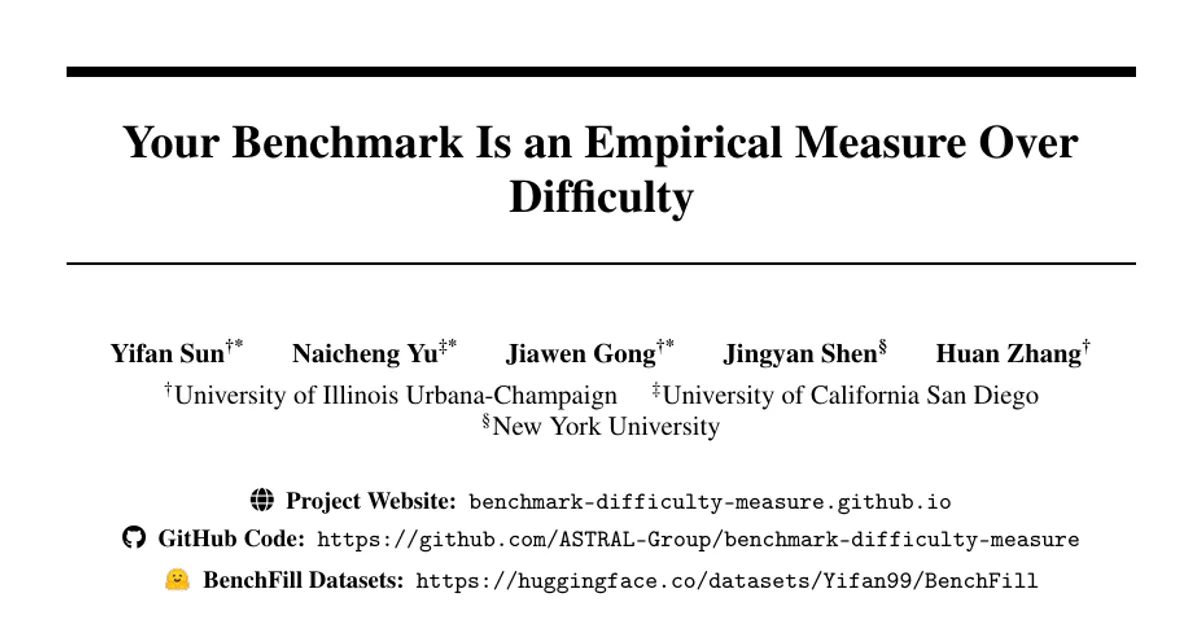
Your Benchmark Is an Empirical Measure Over Difficulty
Overview Research area: Machine learning evaluation methodology — the science of benchmarking, difficulty estimation, and benchmark design. Technical level: Intermediate. The core ideas are intuitive
- arXiv
- 2610.29927
- Published
- 2026-10-21
- Authors
- Yifan Sun, Naicheng Yu, Jiawen Gong, Jingyan Shen, Huan Zhang
AI summary
Overview
Research area: Machine learning evaluation methodology — the science of benchmarking, difficulty estimation, and benchmark design.
Technical level: Intermediate. The core ideas are intuitive (benchmarks as distributions over difficulty), but the formal treatment uses measure theory, 1-Wasserstein distance, Lipschitz continuity, and minimax hypothesis testing. The empirical half is accessible to anyone familiar with leaderboards and IRT-style difficulty models.
Scope: The paper reframes benchmark evaluation as integration against an empirical difficulty measure, formalizes two failure modes of that measure (distribution mismatch and coverage gaps), diagnoses 25 benchmarks across 7 domains, and introduces a rewriting algorithm, BenchFill, that fills the largest difficulty gaps.
What This Paper Is About
A benchmark score is an average over test items, which implicitly means the benchmark is a probability distribution over question difficulty — and that distribution, not just the models, shapes the conclusion. If a benchmark overweights easy questions, two models can look tied even when they clearly differ on hard questions; if it has no questions in some difficulty band, real training progress inside that band can be invisible. The paper turns this intuition into a formal framework, measures how badly real benchmarks violate it, and provides a method for patching the gaps.
Key Contributions
-
A measure-based formalization of benchmarks. Each benchmark $B = {x_i}{i=1}^{n}$ with item difficulties $z_i \in [0,1]$ is represented as an empirical measure $\nu_B = \frac{1}{n}\sum{i=1}^{n}\delta_{z_i}$, so that the benchmark score is exactly $S_B(\theta) = \int s_\theta(z),d\nu_B(z)$. This makes evaluation conclusions a product of two separable objects: the model-dependent performance function and the benchmark-dependent measure.
-
Two named failure modes with diagnostic metrics. Measure mismatch is quantified by the Difficulty Distribution Mismatch, $\mathrm{DDM}(B,\mu) = W_1(\nu_B,\mu)$, the 1-Wasserstein distance to a target distribution $\mu$. Coverage gaps are quantified by the maximum gap $G(B) = \max_{0 \le j \le n}(z_{(j+1)} - z_{(j)})$ between adjacent sorted difficulty points (with $z_{(0)} := 0$ and $z_{(n+1)} := 1$), plus the sum of the five largest gaps as a reference metric.
-
Theoretical guarantees for both metrics. Theorem 2.1 bounds score distortion by $L \cdot W_1(\nu_B,\mu)$ for $L$-Lipschitz $\Delta$ and gives a rank-stability condition; Theorem 2.2 shows the uniform distribution is the unique maximin target under complete uncertainty about where performance differences lie; Theorem 2.3 shows the maximum gap is the exact asymptotic minimax detection boundary for localized improvements.
-
An empirical audit and a repair method. An analysis of 25 benchmarks spanning 7 domains using IRT-estimated difficulties, plus BenchFill, a difficulty-targeted item-rewriting search that reduces the sum of the top three gaps by 21.09%–38.88% with only three inserted items per benchmark.
Main Findings
-
Measure mismatch is common. 10 of 25 benchmarks have $\mathrm{DDM} \ge 0.10$, meaning their difficulty mass must be moved an average of at least 10% of the full difficulty range to match a same-size uniform reference. The largest reported values are ScienceQA (0.178, 4,241 items), MATH-500 (0.164, 500 items), MBPP+ (0.163, 378 items), IFEval (0.159, 541 items), and MedQA (0.157, 1,273 items).
-
Coverage gaps are common too. 8 of 25 benchmarks have Max Gap $\ge 0.10$, including AMC23 (0.217), AIME24 (0.179), HumanEval (0.165), AIME25 (0.158), SWE-bench-Mini (0.149), BBH-5 objects (0.128), AIME26 (0.119), and CORE-Bench Hard (0.113).
-
Gaps are not just a small-benchmark artifact. 9 of 25 benchmarks have Top-5 Sum $\ge 0.30$, and the authors explicitly note that benchmarks with hundreds of items — HumanEval (164 items, Top-5 Sum 0.423) and BBH-5 objects (250 items, 0.332) — show substantial gap metrics. AIME24 and AIME25 have top-5 gap sums close to 0.5 despite being widely used for monitoring RLVR training.
-
The uniform target is theoretically justified, not just convenient. Under an uncertainty set $\mathcal{F}\rho$ of measurable $\Delta: [0,1] \to [-1,1]$ with fixed mean $\rho$, the worst-case retained difference $V\rho(\mu)$ is maximized at $\rho$ only by $\lambda = \mathrm{Unif}[0,1]$. The authors are careful to say this is a defensible default in the absence of priors, not a universal optimum.
-
Below the gap width, localized improvement is undetectable in the worst case. If the improvement interval width $w \le G(B)$, the minimax worst-case power of any level-$\alpha$ test equals $\alpha$ for every number of repeated samples $k$. Once $w > G(B)$, power tends to 1 as $k \to \infty$. More rollouts cannot fix a structural blind spot.
-
BenchFill works and nearly matches an oracle. Across 8 benchmarks and 3 inserted items each, BenchFill reduces Top-3 Gap Sum by 21.09%–38.88%, averaging 32.67%, versus 17.52% for a budget-matched best-of-$N$ uniform-parent baseline and 35.06% for an idealized oracle. On AIME24, AIME25, and AIME26 it matches the oracle exactly.
-
Rewritten items land near their targets. BenchFill's mean absolute Target Deviation is below 0.01 on every benchmark (average 0.005), compared with 0.048 for the baseline.
-
Curated gap-filled benchmarks were released. AMC23 expanded from 40 to 80 items, AIME24 from 30 to 50, AIME25 from 30 to 52, and AIME26 from 30 to 53, all manually reviewed, released as AMC23-BenchFill, AIME24-BenchFill, AIME25-BenchFill, and AIME26-BenchFill.
Methodology in Plain English
Step 1 — Estimate how hard each item is. Rather than using raw average failure rates, the authors fit a one-parameter logistic Item Response Theory model, $\Pr(Y_{ij}=1) = \sigma(\theta_j - b_i)$, where each model gets an ability $\theta_j$ and each item gets a difficulty $b_i$. This accounts for which models failed an item, not just how many. Estimation is Bayesian, via MCMC.
Step 2 — Make the estimates trustworthy. For non-agentic benchmarks they select 12 LLMs spanning 1.7B to 397B parameters, sampled in strata along a public leaderboard ranking, with extra models at the top and bottom of the capability range; each model is run on each item with up to 32 rollouts at model-recommended temperature and top-$p$. Agentic benchmarks instead use evaluation results from HAL, which reports 15–66 state-of-the-art closed-source LLMs. They run 4 pre-fit diagnostics on the response matrix and 3 post-fit Bayesian diagnostics (Gelman–Rubin $\hat{R}$, effective sample size, divergent transitions) — all 7 pass for all benchmarks — plus a leave-one-out robustness check suggesting 12 models suffice.
Step 3 — Measure the two problems. Normalize difficulties to $[0,1]$ and compute the empirical CDF. DDM is the $L_1$ distance between that ECDF and a same-size uniform reference (equivalent to 1-Wasserstein in one dimension). Max Gap and Top-5 Sum are read directly off the sorted difficulty list.
Step 4 — Fill the worst gaps with BenchFill. For a chosen gap $[z_L, z_R]$, the target is the midpoint $z^\star = (z_L+z_R)/2$. The algorithm maintains a memory of item–difficulty pairs, retrieves the 4 parents closest to $z^\star$, and prompts a rewriter LLM with the parent, the target, and up to 16 nearby reference pairs (e.g., items at 0.48, 0.50, 0.60, 0.62 when $z^\star = 0.55$). Each parent yields 4 children; children are validated (GPT-5.4 is used as a validity judge for answer correctness), annotated with difficulty, and written back into memory so later rounds condition on progressively better examples. Difficulty annotation is an online calibration: model abilities are held fixed and only the new item's parameter $b$ is fit by maximum likelihood on the new responses. The run uses MiniMax-M2.7 at temperature 1.0 for at most 8 rounds, and the final item is manually reviewed by human experts before insertion.
Why This Matters
Impact on research. The paper reframes a practice everyone treats as neutral — averaging over a test set — as a modeling choice with measurable consequences. It supplies language (measure mismatch, coverage gap), diagnostics with proofs, and public difficulty estimates for 25 benchmarks, which lets other researchers audit whether a leaderboard conclusion is an artifact of item placement rather than a fact about models.
Real-world applications:
- Leaderboard interpretation. A practitioner comparing two models on a high-DDM benchmark such as ScienceQA or MATH-500 should check whether the benchmark's implicit difficulty weighting matches their deployment distribution before treating a small gap as meaningful.
- Training-run monitoring. Teams using AIME24/AIME25 to detect RLVR progress now have a concrete warning: with top-5 gap sums near 0.5, substantial localized gains can go unrecorded, and more rollouts will not help by Theorem 2.3.
- Benchmark construction and augmentation. BenchFill offers a cheap, scalable way to extend an existing benchmark at a specified difficulty without authoring items from scratch, and the released BenchFill variants give the math-evaluation community denser difficulty coverage.
- Model selection under budget. Knowing where a benchmark is uninformative prevents premature abandonment of promising training runs and misallocated compute.
Industry relevance. Any organization that gates model releases on benchmark scores, or that tracks training progress with held-out evals, inherits both failure modes. The diagnostics are cheap to compute once difficulties are estimated, and the paper releases code and difficulty data for exactly that purpose.
Future Directions
- Choosing targets when priors exist. The paper justifies the uniform target only as a neutral default. How should $\mu$ be set when a real deployment difficulty mix is known, and how sensitive are rank conclusions to that choice? An appendix sketches a calibration algorithm for moving a benchmark toward an arbitrary target, but this is not empirically evaluated in the main text.
- Beyond the two failure modes. The limitations section states explicitly that the goal is not to exhaust the consequences of the measure-theoretic view, leaving room to formulate additional benchmark failures and design objectives as properties of $\nu_B$.
- Scaling gap filling beyond 8 benchmarks and 3 gaps. BenchFill is demonstrated on 8 benchmarks with 3 inserted items each; whether targeted rewriting preserves validity and difficulty calibration at much larger insertion budgets, and across non-math domains, is untested here.
- The estimation-dependence question. All diagnostics rest on IRT-estimated difficulties from a specific model panel (12 LLMs for non-agentic tasks; 15–66 closed-source models via HAL for agentic tasks). How robust the reported DDM and gap values are to different panels, to 2PL or multidimensional IRT specifications, and to the choice of normalization remains an open practical question — the paper offers partial robustness checks (leave-one-out, model-comparison analyses in the appendix) but the truncated text does not report their outcomes.
Target Audience
Benchmark designers and maintainers, evaluation researchers studying leaderboard validity, and ML teams that use held-out benchmarks to monitor training or gate releases. It is most valuable to readers comfortable with basic probability who want a rigorous but compact account of why aggregate scores can mislead — and to IRT-literate readers who will recognize the difficulty-estimation pipeline and can build on the released estimates. Readers seeking an off-the-shelf leaderboard critique will find the diagnostics directly usable; readers seeking implementation-level detail on the rewriter prompts or annotation pipeline will need the appendices.
Authors’ abstract
A benchmark is not merely a collection of test questions; it naturally induces an empirical measure over difficulty. In this work, we develop this measure-based view of benchmark evaluation. This perspective allows us to identify and formalize two central failure modes: measure mismatch, where the benchmark difficulty distribution differs from the intended difficulty distribution, and coverage gaps, where uncovered regions along the difficulty axis prevent benchmarks from detecting meaningful localized training progress. We propose two diagnostic metrics that capture these two failure modes and provide rigorous theoretical guarantees. Empirically, we analyze 25 popular benchmarks spanning 7 domains using carefully estimated item difficulties. Our results show that many benchmarks implicitly overweight certain difficulty regions, so their leaderboard conclusions should be interpreted with caution; others leave substantial portions of the difficulty axis uncovered, limiting their ability to monitor the model improvement process. Finally, we turn diagnosis into action by introducing BenchFill, a simple difficulty-targeted item rewriting algorithm that effectively reduces local coverage gaps.