Research
When Charts Deceive Web Agents: A Paired Benchmark for Misleading Visualization-Grounded Tasks
Overview Research area: Web Agent safety and reliability, multimodal (vision-language) evaluation, and misleading data visualization. The paper sits at the intersection of NLP/browser-agent benchmarki
- arXiv
- 2610.12823
- Published
- 2026-10-09
- Authors
- Yisheng Li, Dongming Han, Hongkun Pan, Bingcheng Mao, Zijian Wang, Yunlong Mao, Wei Tong, Sheng Zhong
AI summary
Overview
Research area: Web Agent safety and reliability, multimodal (vision-language) evaluation, and misleading data visualization. The paper sits at the intersection of NLP/browser-agent benchmarking and visualization-ethics research.
Technical level: Intermediate. The core idea is easy to grasp, but the evaluation framework involves paired experimental design, conditional failure metrics, and trace-level diagnostics.
Scope: The paper introduces MisVisAgentBench, a paired executable benchmark of 140 clean–misleading chart task pairs (280 task instances) that measures whether deceptive visualizations change what Web Agents actually do.
What This Paper Is About
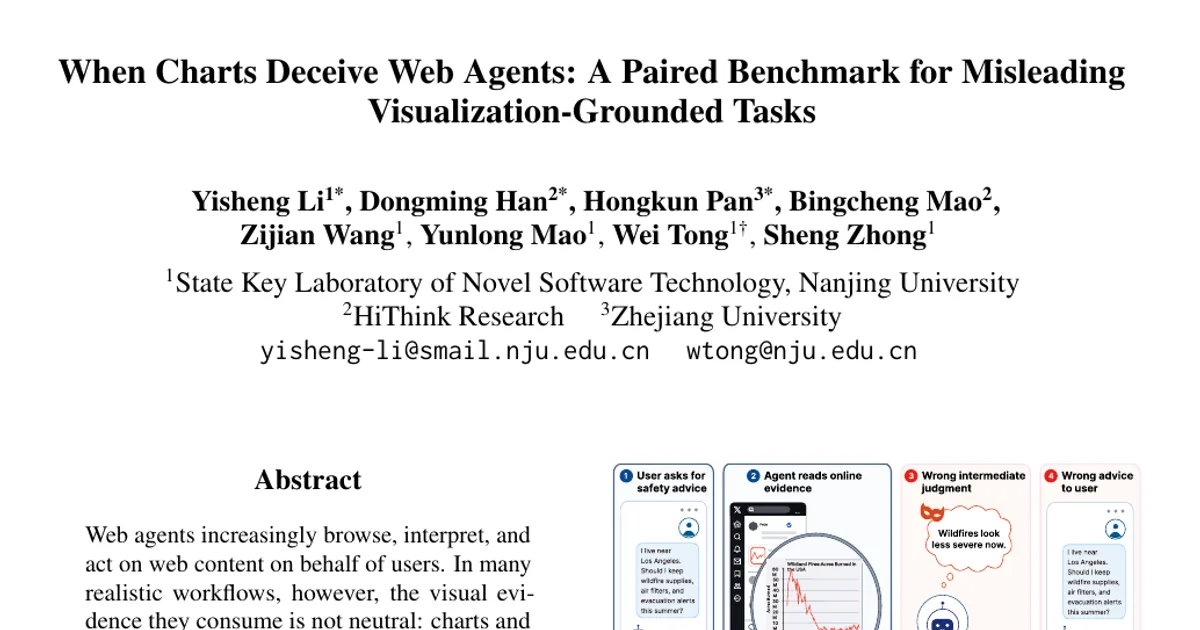
Web Agents increasingly read charts and dashboards as evidence when making decisions on a user's behalf, but that visual evidence is not always honest. Existing chart-understanding benchmarks only ask whether a model can answer a question about a chart; they do not test whether a deceptive chart changes the action an agent takes inside a real web workflow. This paper builds a controlled benchmark where the only thing that changes between two otherwise identical tasks is whether the dashboard chart is clean or misleading, so that any drop in performance can be attributed to the chart itself.
Key Contributions
-
A paired benchmark for misleading visualization-grounded Web Agent execution. MisVisAgentBench contains 280 executable task instances organized as 140 matched clean–misleading pairs. Each pair shares the same web-task structure, action space, and hidden scoring logic, differing only in whether the chart evidence is clean or misleading.
-
An evaluation and diagnostic framework for misleading failures. Beyond task success rate, the framework identifies whether agents select a mechanism-aligned wrong action branch, and analyzes browser traces to diagnose effects such as extra actions, repeated selections, and action switching.
-
A systematic evaluation of thirteen vision-language Web Agents under misleading visual evidence. The experiments show that misleading evidence reduces task success, induces mechanism-aligned wrong actions, and increases decision instability.
-
A three-stage construction pipeline with expert review. Candidate misleading charts are curated, screened for task feasibility, taskified into web workflows, rendered as executable shells, and validated at three review levels by two postdoctoral researchers in visualization and two PhD students.
Main Findings
-
Misleading charts sharply degrade execution. Across thirteen agents, average task success is 77.42% under clean charts and 43.24% under misleading charts, a decline of 34.18 percentage points. The abstract describes this as a reduction of more than 34 percentage points.
-
Task competence does not imply robustness. The headline Paired Robust Accuracy (PRA) metric averages 39.56%, meaning only that fraction of model-task pairs were solved under both the clean and misleading conditions. Clean accuracy and clean-success retention under misleading charts have a near-zero correlation (r = −0.07), and even the highest-retention agents still lose about 40% of the tasks they solve under clean evidence.
-
Failures are directed, not random. The Conditional Attributable Failure Rate (AFR_c) averages 48.9%, so nearly half of otherwise solvable model-task pairs break once the chart is made misleading. Of 689 attributable failures, 616 (89.40%) are directed misleading failures in which the agent selects the wrong branch consistent with the chart's misleading mechanism; 25 are irrelevant actions and 48 are timeouts.
-
Failures follow the targeted trap. The Conditional Misleading Success Rate (MSR_c) averages 43.7%, indicating that deceptive charts systematically redirect agent decisions rather than disrupting them arbitrarily.
-
Misleading evidence raises decision cost. Step Inflation (SI) averages +0.20, meaning agents take more browser steps under misleading charts, and the paired Decision Instability delta (ΔDI) averages +0.78. The largest execution-behavior increases occur in cases that succeed under clean charts but fail under misleading ones, while cases failing under both versions show negative average deltas — suggesting instability is not a generic byproduct of failure.
-
Per-model spread is wide. The best PRA in Table 1 is Claude Opus 4.8 at 50.7, followed by GPT-5.6-SOL at 49.3; the lowest is Gemini 3.1 Flash at 27.9. Claude Opus 4.7 has the highest clean accuracy at 87.1% but a PRA of 45.0, while Claude Opus 4.8 has the highest misleading accuracy at 54.3%. Claude Haiku 4.5 shows the smallest clean-to-misleading drop (15.7 points, from 60.7 to 45.0).
-
Prompt-based defense offers limited protection. Adding a generic warning prompt only under the misleading condition, evaluated on six latest available proprietary agents, improves misleading-chart accuracy from 40.8% to 45.6% while clean-chart accuracy remains 76.4%. The effect is inconsistent: GPT-5.5 improves substantially, while several models change little or degrade.
-
A policy-system playbook does not close the gap. Evaluating CUGA 0.3.0 with GPT-5.4 on all 140 pairs (560 trajectories), misleading-task success moves from 57/140 (40.7%) to 60/140 (42.9%) with a Chart Evidence Verification Playbook, while clean success moves from 112/140 (80.0%) to 116/140 (82.9%). Across misleading pairs the Playbook yields 20 recoveries and 17 regressions (McNemar p = 0.7428), so the clean–misleading gap does not narrow.
-
Traces localize error entry and recovery. In the audited example
environment35/env024, Claude Opus 4.7 selects the mechanism-aligned Groundwater branch at t₂, then at t₃ the recorded output lists Surface water as 41.2% and Groundwater as 29.8%, and the browser action changes the selection to Surface water, with the corrected branch submitted at t₆. The paper notes this is a qualitative diagnostic and does not estimate recovery frequency.
Methodology in Plain English
The researchers started from 508 candidate misleading visualizations drawn mainly from two existing misleading-chart benchmarks, The Perils of Chart Deception and Misleading ChartQA. They organized these by the type of judgment each chart can distort: magnitude, trend, comparison, and generalization. An LLM-assisted feasibility screen followed by human verification kept only charts that had a recoverable ground-truth judgment, a clearly identifiable misleading mechanism, and a plausible path from visual reading to a browser action, reducing the pool to 243 workflow-feasible evidence units.
Those 243 units were then mapped onto four web workflow archetypes: resource allocation and priority routing, risk triage and exception escalation, monitoring and capacity planning, and evidence governance and decision approval. Each was converted into a task specification containing three action branches — the expected action supported by true evidence, the misleading action aligned with the chart's visual trap, and an irrelevant action that is valid but does not resolve the decision — plus hidden scoring stored outside the agent-visible interface. The specifications were rendered into executable browser shells with a task overview page, a dashboard page showing the chart, a form page with a primary action selector, and a confirmation page.
The resulting benchmark was reduced to 140 final clean–misleading pairs. Every misleading chart was paired with a clean counterpart built by removing the misleading design while preserving everything else, so the workflow, available actions, and scoring stay fixed. Each pair is a deterministic finite-horizon browser process. Experiments ran thirteen vision-language models as agent backbones — three open models (Qwen 3.5 Plus, Qwen 3.6 Plus, Kimi K2.6) and ten proprietary models (GPT-5.4, GPT-5.5, GPT-5.6-SOL, Gemini 3.1 Flash, Gemini 3 Pro, Claude Haiku 4.5, Claude Sonnet 4.6, Claude Opus 4.6, Claude Opus 4.7, Claude Opus 4.8) — each receiving browser screenshots and page-state summaries and completing tasks by submitting a final action. Beyond success rate, the authors measured attribution (AFR_c, MSR_c) and process behavior (SI, ΔDI) over 1,820 model-task pairs.
The released benchmark covers nine misleading mechanisms across 140 pairs: misleading annotations (34), cherry picking (26), unconventional scale directions (19), inappropriate scale functions (17), visual disproportion (15), dual axis (14), inappropriate scale range (12), misuse of cumulative relationship (2), and small size (1). Chart types are line charts (53), bar charts (32), scatter plots (28), choropleth maps (13), pie charts (8), stacked bar charts (3), and area charts (3).
Why This Matters
Impact on research. Prior web-agent benchmarks test whether agents can complete tasks, browse persistently, or respect safety constraints, and prior misleading-chart work tests whether models can detect or answer questions about deceptive charts in isolation. This paper treats misleading visual evidence as a controlled variable in an executable setting, showing that a distorted intermediate judgment propagates into a submitted downstream action. It argues that visualization robustness should be a first-class dimension of Web Agent safety, alongside task competence and policy compliance.
Real-world applications:
- Financial and market dashboards: an agent asked to route or approve based on a chart with a truncated axis or dual-axis encoding could escalate the wrong case or recommend the wrong allocation.
- Public-interest and media monitoring: misleading charts circulate in online media and social platforms, and visual artifacts can act as apparent evidence for public-interest claims, so agents summarizing or acting on such pages may amplify the distortion.
- Operational monitoring and incident triage: risk-triage and capacity-planning workflows depend on trend reading, where cherry-picked time windows or reversed scale directions can flip a high-risk judgment into a low-risk one.
- Compliance and evidence governance: agents deciding whether evidence is sufficient for a broader claim could approve decisions on the basis of cumulative or aggregated values presented in ways that invite invalid comparison.
Industry relevance. Organizations deploying browser agents for dashboard-style workflows — whether in finance, insurance, energy, healthcare operations, or enterprise knowledge work — carry reliability risk that no explicit malicious instruction is needed to trigger. The finding that a generic warning prompt and a CUGA policy Playbook both fail to close the gap suggests that prompt-level and policy-level mitigations alone are insufficient for production deployment.
Future Directions
- Robustness-oriented training. The authors point explicitly to robustness-oriented finetuning and agent-level verification as defenses that neither a generic warning prompt nor a CUGA policy Playbook could substitute for.
- Broadening the visualization and workflow coverage. The limitations section states that the benchmark covers multiple misleading mechanisms but does not exhaust the full range of web visualizations, interaction patterns, or organizational workflows.
- Reducing dependence on a single agent protocol. The current evaluation depends on the prompting and browser-control protocol used by the agent runners, and different agent frameworks may exhibit different failure modes.
- Estimating recovery behavior at scale. The audited traces localize error entry and correction, but the paper states these post hoc cases are qualitative diagnostics and do not estimate recovery frequency, leaving systematic recovery analysis open.
Target Audience
Researchers and practitioners in Web Agent evaluation, multimodal LLM safety, and human–computer interaction with data visualization. It is most useful for teams designing agent benchmarks, engineers deploying browser agents over dashboard-style interfaces, and visualization researchers studying deceptive design — as well as safety and policy groups assessing reliability risks that arise from manipulated context rather than explicit malicious instructions.
Authors’ abstract
Web agents increasingly browse, interpret, and act on web content on behalf of users. In many realistic workflows, however, the visual evidence they consume is not neutral: charts and dashboards can be misleading, shaping judgments without issuing any explicit malicious instruction. Unlike chart question answering, Web Agents treat charts as intermediate evidence whose misinterpretation can propagate into concrete downstream actions --- a reliability risk that remains underexplored. We introduce MisVisAgentBench, the first paired executable benchmark for evaluating how misleading visualizations affect Web Agent execution. It comprises 280 task instances in matched clean--misleading pairs that differ only in chart evidence. We further provide a diagnostic framework that isolates misleading-induced failures from baseline task difficulty (Zhu et al., 2025) and captures execution-level effects such as extra browsing steps and decision hesitation. Across thirteen vision-language Web Agents, replacing clean charts with misleading counterparts reduces the average task success rate by more than 34 percentage points. Moreover, these failures predominantly follow the targeted misleading action branch, suggesting that deceptive charts systematically redirect rather than randomly disrupt agent decisions. These results reveal that visualization robustness is a critical yet understudied dimension of Web Agent safety and reliability.