Research
SciFigBench: A Benchmark for Scientific Method Figure Understanding
Overview Research area: Computer vision / multimodal evaluation — specifically benchmarks for Vision Language Model (VLM) understanding of scientific diagrams. Technical level: Intermediate. Readers s
- arXiv
- 2610.27087
- Published
- 2026-10-19
- Authors
- Lijia Wu, Zheng Li, Yuxuan Liu, Jingwen Zhang, Penghai Zhao, Xiang Li
AI summary
Overview
Research area: Computer vision / multimodal evaluation — specifically benchmarks for Vision Language Model (VLM) understanding of scientific diagrams.
Technical level: Intermediate. Readers should know what VLMs are, what a benchmark/QA evaluation looks like, and be comfortable with terms like accuracy and ANLS. No deep math is required.
Scope (one sentence): The paper introduces SciFigBench, a diagnostic benchmark of 4,352 real scientific method figures and 40,670 QA pairs targeting three capabilities (dense content perception, visual relation comprehension, information-flow tracing), plus SciFigCue, a training-free visual prompting module that makes arrow cues explicit for VLM reasoning.
What This Paper Is About
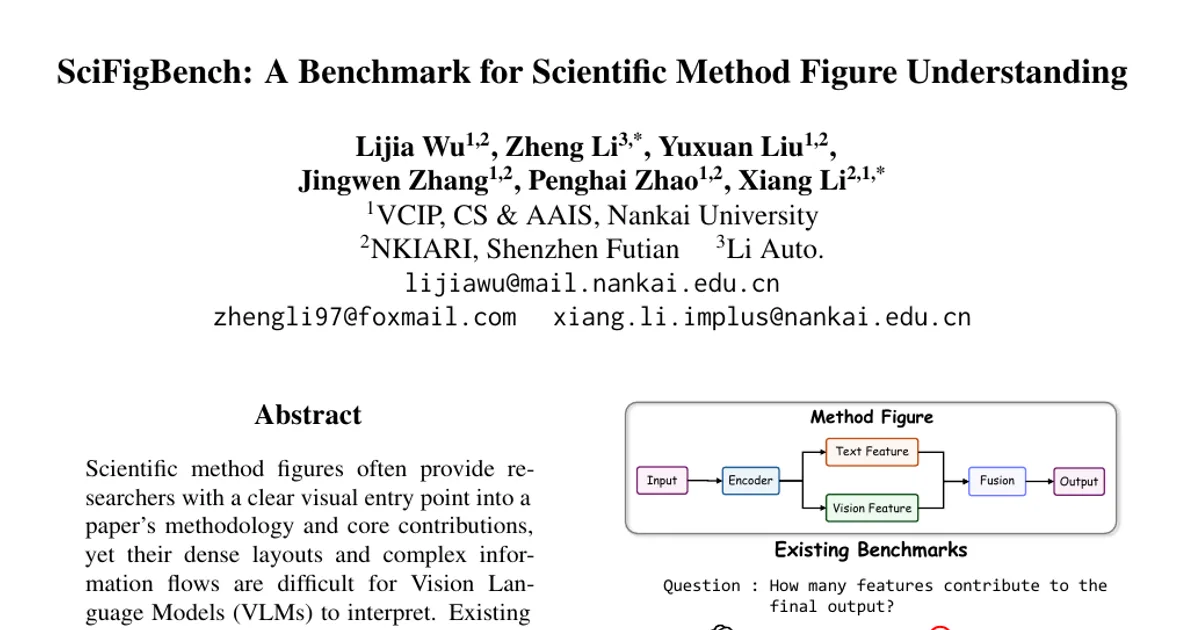
Scientific method figures — the architecture and pipeline diagrams in papers — pack a method's logic into text labels, visual modules, and arrows, but current VLMs read them poorly. Existing benchmarks test only coarse abilities (retrieval, holistic description), so a wrong answer tells you nothing about why the model failed: missed text, a misread arrow, or a broken multi-step trace. The authors build a benchmark that separates these failure sources into distinct diagnostic tasks, then propose a simple input-side fix that surfaces arrow structure to the model without any retraining.
Key Contributions
- SciFigBench, a diagnostic benchmark for figure-internal understanding of real scientific method figures, organized around three evaluation perspectives rather than a single aggregate score.
- A human-verified dataset of 4,352 method figures curated from 2024–2025 AI conference papers and 40,670 QA pairs across five tasks, built with an automated annotation pipeline (OCR–VLM cross-validation for text, segmentation plus endpoint labeling for structure) and then verified by 20 trained annotators.
- SciFigCue, a training-free visual prompting module that renders arrow locations, head–tail directions, and query-relevant target regions as visual cues, changing only the input representation — not the answer space, evaluation protocol, or model parameters.
- An empirical diagnosis showing that current VLMs, including strong proprietary ones, remain near chance on path-level structural reasoning, and that explicit connection cues improve several structure-dependent tasks without parameter updates.
Main Findings
- Structural reasoning is the hard part. Chance accuracy is 50.0 on both Edge-Level Verification and Path-Level Reachability. Many strong models sit near that floor: Qwen3.5-VL-27B scores 50.2 and Qwen3-VL-32B scores 49.4 on Path-Level Reachability.
- Text perception is also unsaturated. Among models evaluated without SciFigCue, the best Dense Content Perception score is 76.8 (GPT-5.5) and the best Information-Flow Tracing score is 46.1 (Gemini-3.1-Flash-Lite). The best Node-Level Degree Counting result reaches only 55.8.
- Scaling helps reading, not structure. Going from Qwen3.5-VL-2B to 27B gains 51.1 points on Dense Content Perception and 27.3 on Information-Flow Tracing, but only 1.0 point on Path-Level Reachability — so capacity alone is not the bottleneck.
- SciFigCue lifts structure-dependent tasks. On Qwen3.5-VL-9B it raises Dense Content Perception from 61.2 to 73.0 (+11.8), Edge from 50.8 to 56.6 (+5.8), Reachability from 46.3 to 52.0 (+5.7), and IFT from 32.8 to 36.0 (+3.2). On Qwen3.5-VL-27B it raises Edge from 59.2 to 70.1 (+10.9) and DCP from 70.9 to 82.4 (+11.5), while IFT drops slightly from 43.6 to 42.1 (-1.5).
- Multi-region reading is a distinct weakness. On Dense Content Perception, the K=1 score exceeds the K≥2 average by 30.5 points for Qwen3.5-VL-9B and 10.1 points for Qwen3.5-VL-27B; SciFigCue narrows those gaps to 22.5 and 5.5 points respectively.
- Gains come from correct arrow semantics, not salience. In a controlled ablation on Qwen3.5-VL-9B, a randomized arrow cue falls back near the raw baseline (Edge 49.9 vs. 50.8 raw, SciFigCue 56.6). Arrow-location cues alone help Edge (53.8) and Reachability (48.7) but hurt Degree (37.8 vs. 41.4 raw), indicating degree counting depends on direction, not just layout.
- Cue quality still matters. Replacing automatically parsed cues with human-verified ones improves Degree (44.1 to 46.1 for 9B; 51.1 to 52.7 for 27B) and IFT (36.0 to 36.9 for 9B; 42.1 to 43.6 for 27B), eliminating the IFT degradation on the 27B model.
- Parsing is the upstream bottleneck. An AutoParse+Symbolic baseline that does deterministic graph reasoning over automatically recovered structure scores 96.3 DCP, 77.1 Edge, 57.0 Degree, 65.2 Reachability, and 48.4 IFT — far above Qwen3.5-VL-27B, but below the human-verified oracle (100.0 on all tasks). The authors attribute this gap mainly to missing, spurious, or reversed edges in automatic parsing.
Methodology in Plain English
The authors started with 20,000 paper PDFs from AI conferences, pulled candidate method figures from captions, and filtered out anything not method-centric, lacking clear information flow, or too sparse in text, leaving 4,352 figures.
For each figure they built two kinds of annotation. Content annotation captures every text string together with its bounding box; because the text in these figures is small and dense, an OCR model proposes candidates and a verifier VLM picks the more reliable read of each cropped region. Structural annotation captures the diagram as a directed graph: a segmentation model produces node and arrow masks, node masks become boxes, arrow masks are skeletonized to find endpoints, and a VLM decides for each endpoint whether it is an arrow head or tail. Endpoints are then matched to the nearest node boundary, giving directed connections from tail node to head node.
Twenty annotators with over three hours of calibration training each verified the machine output rather than labeling from scratch; the pipeline reached an overall F1 of 82.21% across the two annotation types. From the verified annotations the authors generated five QA tasks grouped under the three capabilities: Dense Content Perception (read K highlighted text regions in flow order, K ≤ 6), Edge-Level Verification (does a directed edge exist from the red node to the blue node), Node-Level Degree Counting (how many arrows enter or leave a highlighted node), Path-Level Reachability (is the blue node reachable from the red node), and Information-Flow Tracing (list the text of all direct in- or out-neighbors of a node named by its label, with no box prompt). Metrics are position-wise ANLS for DCP, set-based ANLS* for IFT, and accuracy for the three relation tasks.
SciFigCue reuses that same parsing pipeline at test time. For multi-target queries it shows the original figure alongside an auxiliary arrow-mask view with target regions overlaid; for single-target queries it overlays arrow endpoint cues directly on the original figure. Evaluation covers open-source families (InternVL3.5, LLaVA-OV-1.5, Qwen3-VL, Qwen3.5-VL) on the full test set, and Gemini and GPT models on 2,000 QA pairs sampled proportionally by task because of inference cost.
Why This Matters
Benchmarks that report a single score cannot tell a developer whether a model failed to read the label or failed to follow the arrow, so they give no direction for improvement. SciFigBench turns that aggregate into a diagnosis, and SciFigCue shows that a large part of the gap can be closed by changing what the model is shown rather than retraining it — an unusually cheap intervention for a capability that scaling barely touched.
Real-world applications:
- Literature triage tools that summarize a paper's architecture from its main figure, where correctly following the pipeline matters more than transcribing labels.
- Automated paper reviewing and reproducibility checks, which need to verify that a described pipeline matches the diagram.
- Scientific figure search and retrieval, where queries like "papers that feed X into Y" require directed relation understanding.
- Accessibility and figure-to-text generation for readers who cannot inspect the diagram directly.
- Research assistants and agents that must parse a method's procedural steps before answering questions about it.
Industry relevance: any organization building document or figure intelligence for technical content — scholarly publishing, R&D intelligence platforms, patent analysis, or model-development tooling — faces the same failure mode. The finding that arrow-direction reasoning stays near chance while text reading scales normally is directly actionable for teams deciding whether to spend on bigger models or on better input preprocessing.
Future Directions
- Broaden beyond AI venues. The dataset is restricted to 2024–2025 AI conference papers, so it misses the visual conventions, notations, and arrow semantics of other scientific domains. Extending SciFigBench across disciplines, and adapting SciFigCue to domain-specific conventions, is the stated next step.
- Reduce residual annotation error. The pipeline is automatic-first with human verification, and the authors acknowledge that ambiguous or erroneous cases may remain at this scale; they plan to refine the benchmark from community feedback.
- Improve upstream figure parsing. SciFigCue's effectiveness is bounded by the same parsing pipeline, and the AutoParse+Symbolic results show the oracle gap is mostly structure-recovery error. Better segmentation and head/tail detection would likely lift both the benchmark ceiling and the prompting gains.
- Push beyond input-level fixes. Since training-free cues already help but do not close the gap, an open question is whether training on verified structural annotations — or architectures that reason over extracted graphs explicitly — would be needed for reliable composition of arrow-induced connections.
Target Audience
VLM researchers and benchmark designers working on document, chart, or diagram understanding; evaluation engineers who need to attribute model failures to specific capabilities rather than a single score; and practitioners building figure-intelligence or scientific-document products who want to know where current models actually break. Readers interested in cheap test-time interventions will find the SciFigCue ablations, particularly the randomized-arrow control, the most transferable part.
Authors’ abstract
Scientific method figures often provide researchers with a clear visual entry point into a paper's methodology and core contributions, yet their dense layouts and complex information flows are difficult for Vision Language Models (VLMs) to interpret. Existing benchmarks predominantly focus on coarse-grained tasks, such as context-based retrieval or holistic comprehension, overlooking the fine-grained content and inter-module relations within complex methodological diagrams. To address these overlooked aspects, we introduce Scientific Figure Benchmark (SciFigBench), a benchmark for evaluating core capabilities required for scientific method figure understanding. Specifically, it targets three capabilities: dense content perception, visual relation comprehension, and information-flow tracing. For this purpose, we curate 4,352 scientific method figures from real-world research papers and construct 40,670 QA pairs to operationalize these capabilities as measurable question-answering tasks. All annotations are generated by dedicated pipelines and then manually verified. We further propose SciFigCue, a training-free visual prompting module that externalizes arrow-induced dependencies as visual relational evidence for method-figure reasoning. Experiments across open-source and proprietary VLMs show that even strong models remain substantially limited in visual relation comprehension, while SciFigCue improves performance across several tasks without parameter updates. The code and related resources are available at https://github.com/LeNcyer/SciFigBench.