Research
Sample Count Is Not Enough: Candidate-Generation Strategy Shapes the Energy and Performance of LLM Test-Time Scaling
Overview Research area: Machine learning systems — specifically test-time scaling for large language models, GPU inference scheduling, and energy measurement. Technical level: Intermediate. The paper
- arXiv
- 2609.19499
- Published
- 2026-09-16
- Authors
- Mobina Kashaniyan, Ali Jannesari
AI summary
Overview
Research area: Machine learning systems — specifically test-time scaling for large language models, GPU inference scheduling, and energy measurement.
Technical level: Intermediate. The paper uses standard LLM sampling concepts (self-consistency, best-of-N, plurality voting) and standard systems metrics (latency, throughput, GPU-hours, GPU-device energy), and it explains its measurement boundary and statistics in plain terms.
Scope: The paper holds the number of generated candidates fixed at N = 8 and measures how grouping those candidates into different numbers of sequential generation calls changes latency, throughput, GPU-hours, and gross GPU-device energy for two LLMs on GSM8K prompts, with cross-node and short-output (SciQ/V100) checks.
What This Paper Is About
In multi-candidate test-time scaling, the inference budget is usually described by the candidate count N — how many responses are generated. But N does not say how those responses were executed: the same eight candidates can come from one batched call (1×8) or from eight separate single-candidate calls (8×1). The paper asks whether that execution choice, at a fixed candidate budget, changes the real systems cost of inference, and it measures the answer across latency, throughput, GPU-hours, and gross GPU-device energy.
Key Contributions
-
Formalizing the execution schedule and exposing a reporting gap. The authors define a candidate-generation schedule as S = (b₁, …, b_C) with ∑ b_c = N, where C is the number of generation calls and b_c the candidates per call in call c. They argue that N alone does not fully describe a multi-candidate inference workload, and they audit representative test-time-scaling studies (Self-Consistency, Adaptive-Consistency, Universal Self-Consistency, Large Language Monkeys, Scaling Test-Time Compute, Difficulty-Adaptive SC), finding that these studies report N but generally do not report calls per query, candidates per call, or measured energy.
-
A fixed-budget systems characterization. At N = 8, they measure the end-to-end cost of the 1×8, 2×4, 4×2, and 8×1 schedules on latency, throughput, GPU-hours, utilization, and gross GPU-device energy. On A100 GPUs, serial execution uses 4.64–4.86× as much energy as a single eight-candidate batched call.
-
Robustness checks and practical guidance. They repeat the endpoints on additional A100 nodes, test two models, and run a short-output SciQ/V100 case study. The results support a guideline: when candidates are independent and memory allows it, fewer generation calls with larger batch sizes are more efficient. They also provide minimum reporting recommendations for multi-candidate inference experiments.
Main Findings
-
More candidates help accuracy, as expected. On 500 GSM8K prompts, Phi-3 increases from 81.4% at N = 1 to 89.8% at N = 8, a gain of 8.4 pp with a 95% paired bootstrap interval of [5.8, 11.2] pp. Qwen increases from 51.4% to 69.8%, a gain of 18.4 pp ([14.8, 22.0] pp).
-
The N = 1 and N = 2 accuracies are identical because of tie-breaking. When the first two candidates disagree, each gets one vote and the first candidate is selected; accuracy begins to increase at N = 3, when a majority can form. Random tie-breaking changes expected accuracy by at most 1.4 pp, and conditioning on successful extraction also produces only small changes (for example, Phi-3 at N = 8: primary 89.8, random 90.1, conditioned 89.8; Qwen at N = 8: 69.8, 71.2, 70.5).
-
Increasing batched N raises total cost while improving per-token efficiency. Phi-3 energy rises from 631 to 1286 J/query while energy per token falls from 2.634 to 0.655 J; Qwen energy rises from 596 to 975 J/query while energy per token falls from 2.222 to 0.459 J. Phi-3 and Qwen use different GPUs in this experiment (V100 and A100), so absolute values are not compared across models.
-
Latency and GPU-hours still grow with N. From N = 1 to N = 8, mean latency increases from 5.06 to 8.91 s for Phi-3 and from 5.26 to 7.64 s for Qwen; measured GPU-hours per 1,000 queries increase from 1.41 to 2.47 and from 1.46 to 2.12.
-
At fixed N = 8, more calls means more cost, gradually. Relative to 1×8, the intermediate schedules fall in between rather than showing an effect only at the extreme: 2×4 gives relative energy 1.63 (Phi-3) and 1.66 (Qwen), 4×2 gives 2.71 and 2.86, and 8×1 gives 4.64 and 4.86. Relative P95 latency is 1.81 and 1.97 (2×4), 3.21 and 3.57 (4×2), and 5.77 and 6.12 (8×1).
-
The serial endpoint has wide confidence intervals but a large effect. For 8×1 versus 1×8, energy ratios are 4.64 for Phi-3 (95% CI [4.48, 4.79]) and 4.86 for Qwen ([4.71, 5.02]); P95 latency ratios are 5.77 ([5.38, 5.99]) and 6.12 ([5.70, 6.75]). Throughput falls to 16.7% and 17.9% of the batched baseline.
-
Lower average power does not remove the energy penalty. For Phi-3, mean power decreases from 177.8 W at 1×8 to 139.8 W at 8×1, but mean latency increases by 5.97×, so total energy still increases. GPU time for 1,000 queries rises from 2.09 to 12.49 GPU-hours for Phi-3 and from 2.13 to 11.76 GPU-hours for Qwen.
-
The token volume is matched across schedules. Mean logical generated-token volume varies by only 0.8% across Phi-3 schedules and 1.0% across Qwen schedules, so the differences are not explained by large differences in response length.
-
The effect is stable across nodes. Across three independently scheduled A100 jobs per model, the 8×1/1×8 ratios fall in narrow ranges: gross J/query 4.43–4.64 (Phi-3) and 4.85–4.88 (Qwen); mean latency 5.85–5.97 and 5.50–5.53; P95 latency 5.53–5.77 and 6.06–6.12; throughput retained 16.7–17.1% and 17.9–18.0%.
-
The penalty is not limited to long outputs. Splitting the 100 GSM8K systems prompts into four groups of 25 by mean candidate length, Phi-3 shows energy ratios between 4.40 and 4.77 and latency ratios between 5.45 and 6.16; Qwen shows energy ratios between 4.51 and 5.09 and latency ratios between 5.15 and 5.88. The ratios are not monotonic with response length. The authors note this analysis is descriptive because each group has only 25 prompts.
-
A short-output workload shows the same pattern. On SciQ with V100 GPUs, going from 1×8 to 8×1 increases gross energy by 2.57× for Phi-3 and 3.34× for Qwen, increases mean latency by 2.88× and 4.42×, and drops throughput to 36% and 23% of the batched baseline. Because SciQ uses V100 while the primary study uses A100, the authors do not claim the difference in ratio size is caused only by output length.
-
At scale, the measured gap is large. Applying the measured per-query difference to one million queries would add approximately 1.37 MWh of gross GPU-device energy and 10,401 measured GPU-hours for Phi-3 moving from 1×8 to 8×1; for Qwen, approximately 1.00 MWh and 9,631 GPU-hours. The authors describe these as linear illustrations of the measured configurations, not projections to other deployments.
Methodology in Plain English
The authors separate two things that are usually conflated: how many candidate answers a model produces (N) and how those answers are produced on the hardware. They write the execution pattern as a schedule S = (b₁, …, b_C), where C is the number of generation calls and b_c is the batch size of call c. All schedules share the same prompts, decoding settings, answer extraction, and plurality vote; calls run sequentially on the same allocated GPU, and candidates inside a call are generated together as a batch.
Five studies make up the evaluation. An accuracy scaling study generates eight candidates per prompt for 500 GSM8K prompts and evaluates N ∈ {1, 2, 3, 4, 8} using prefixes of the same pool, giving paired prompt-level comparisons. A batched scaling study uses 100 prompts × 3 repetitions and measures batched N ∈ {1, 2, 4, 8} plus serial N = 8. A schedule sweep fixes N = 8 and runs 1×8, 2×4, 4×2, and 8×1 inside the same A100 job, with two repetitions in forward order and one in reverse order to reduce order and thermal effects. A cross-node check repeats the 1×8 and 8×1 endpoints on two additional A100 nodes per model, giving three independently scheduled A100 jobs per model. A short-output validation repeats the full sweep on 500 SciQ prompts × 3 repetitions on V100 GPUs.
Models are Phi-3-mini-4k-instruct and Qwen2.5-1.5B-Instruct, run on GSM8K and SciQ with temperature 1.0 and top-p 0.95. The GSM8K test split is shuffled with seed 42; the first 100 prompts serve the systems experiments and are part of the 500-prompt accuracy study; prompt order is fixed throughout; two warm-up generations are excluded from measurement.
For systems measurement, each query starts with GPU synchronization and an initial NVML cumulative-energy reading, and ends with another synchronization and final reading. The measured interval includes prompt processing, prefill, decoding, all generation calls, answer extraction, and plurality voting. Model loading, warm-up, reporting-time token counting, and final grading are excluded, and idle energy is not subtracted. The reported quantity is gross GPU-device energy, E_gross = E_NVML,end − E_NVML,start, with average GPU power computed as gross energy divided by query latency. To keep comparisons fair, the authors also track logical token volume: for fixed N = 8, the logical input volume is 8·P_q for every schedule, and the logical generated volume sums over candidates.
Systems results are reported as mean ± SD across three repetitions, with P95 latency computed within each repetition. Accuracy confidence intervals use 10,000 prompt-level bootstrap resamples, paired when comparing candidate budgets; the fixed-N schedule ratios (8×1 versus 1×8) use a hierarchical paired bootstrap that resamples repetitions first, then prompts within each selected repetition, recomputing P95 latency for each bootstrap sample.
Why This Matters
Impact on research. The paper argues that reporting only the candidate count N makes systems results in test-time scaling hard to reproduce and compare. Two experiments with the same model, dataset, decoding settings, and candidate count can have very different systems costs depending on the generation schedule, so the authors recommend reporting generation calls, candidates per call, batching mode, latency, throughput, GPU-hours, and the energy-measurement boundary alongside N. Their audit finds calls per query, candidates per call, and energy are commonly missing from representative studies, while this work reports N, calls per query, candidates per call, inference hardware, and gross GPU-device energy.
Real-world applications.
- HPC batch inference jobs, where the paper notes LLM inference may run as finite batch jobs rather than continuous serving workloads, making the number of sequential calls a schedulable quantity.
- Multi-candidate reasoning pipelines such as self-consistency or best-of-N, where the same candidate budget can be grouped into calls differently without changing the aggregation rule.
- Energy budgeting for GPU clusters, where the choice between one batched call and eight serial calls is shown to change gross GPU-device energy by roughly 4.64–4.86× in the A100 setting.
- Pipeline designs that split generation across calls for logging, deterministic seeding, control logic, or intermediate analysis — the paper explicitly names these as reasons candidate generation may be divided, and shows they carry an energy and latency cost.
Industry relevance. The practical guideline is simple and directly actionable: when candidates are independent and memory allows it, fewer generation calls with larger batch sizes are more efficient. The authors formalize this as b = min(N, b_max) and C = ⌈N/b⌉, choosing the largest batch that fits and the fewest calls. They also flag when this does not apply: memory limits, request dependencies, continuous batching, and serving constraints may require a different schedule, and continuous-serving environments should coordinate with the serving scheduler.
Future Directions
- Isolating the mechanisms behind the penalty. The measurements capture the combined end-to-end effect of the schedule; the authors state they do not isolate how much of the difference comes from repeated prompt processing, per-call framework and synchronization overhead, GPU utilization, or other low-level effects, and that separating these would require more detailed profiling.
- Extending beyond the tested configurations. The authors note their experiments cover two models, two GPU architectures, and batch-scheduled Hugging Face generation, and that the ratios should not be assumed to hold for larger models, other GPU generations, continuous batching systems, or multi-GPU inference.
- Testing additional inference techniques. Future work could extend the study to larger models, continuous batching, quantization, speculative decoding, and multi-GPU execution.
- Building a cost-aware scheduler. The authors suggest a more general scheduler could predict the energy, latency, and memory cost of candidate schedules and select the lowest-cost configuration that satisfies system constraints, rather than relying on the simple largest-feasible-batch heuristic.
Target Audience
This paper is most useful to researchers and engineers who run or evaluate multi-candidate LLM inference and care about systems cost: test-time-scaling and reasoning researchers who need to report reproducibility details, ML systems and HPC practitioners scheduling GPU batch jobs, and infrastructure or capacity planners tracking energy and GPU-hours. It is also
Authors’ abstract
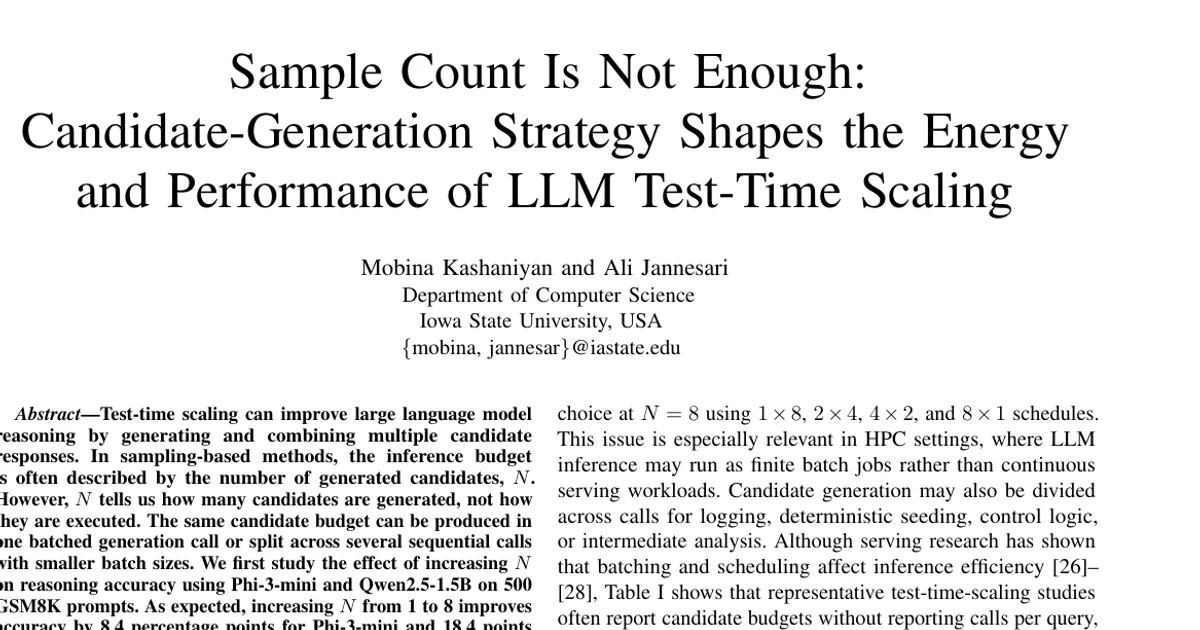
Test-time scaling can improve large language model reasoning by generating and combining multiple candidate responses. In sampling-based methods, the inference budget is often described by the number of generated candidates, N. However, N tells us how many candidates are generated, not how they are executed. The same candidate budget can be produced in one batched generation call or split across several sequential calls with smaller batch sizes. We first study the effect of increasing N on reasoning accuracy using Phi-3-mini and Qwen2.5-1.5B on 500 GSM8K prompts. As expected, increasing N from 1 to 8 improves accuracy by 8.4 percentage points for Phi-3-mini and 18.4 points for Qwen2.5-1.5B. However, accuracy alone does not show the systems cost of using a larger candidate budget. We therefore fix N = 8 and compare four generation schedules: 1x8, 2x4, 4x2, and 8x1, where axb denotes a generation calls with b candidates per call. We measure latency, throughput, GPU-hours, and gross GPU-device energy while keeping the total candidate count fixed. On A100 GPUs, eight serial calls use 4.64-4.86x as much gross GPU-device energy and have 5.77-6.12x the P95 latency of one batched call with eight candidates. The same pattern appears across three independently scheduled A100 nodes per model and in short-output SciQ/V100 experiments. These results show that candidate count alone is not enough to describe the systems cost of multi-candidate test-time scaling. When candidates are independent and memory allows it, fewer generation calls with larger batch sizes are more efficient. Evaluations should therefore report not only candidate count and accuracy, but also generation schedule and GPU-level systems metrics.