Research
Refinement Contrastive Learning of Cell-Gene Associations for Unsupervised Cell Type Identification
Overview Research area: Unsupervised machine learning for single-cell omics — specifically cell-type identification (clustering) from single-cell RNA sequencing (scRNA-seq) and spatial transcriptomics
- arXiv
- 2512.10640
- Published
- 2025-12-11
- Authors
- Liang Peng, Haopeng Liu, Yixuan Ye, Cheng Liu, Wenjun Shen, Si Wu, Hau-San Wong
AI summary
Overview
Research area: Unsupervised machine learning for single-cell omics — specifically cell-type identification (clustering) from single-cell RNA sequencing (scRNA-seq) and spatial transcriptomics data.
Technical level: Advanced. The paper assumes familiarity with graph neural networks, contrastive learning, Kullback-Leibler divergence, and single-cell data analysis pipelines.
Scope: The paper proposes scRCL, a refinement contrastive learning framework that jointly models cell-cell structure, gene-gene correlation, and the cell-gene associations between them to improve unsupervised cell-type identification across both scRNA-seq and spatial transcriptomics data.
What This Paper Is About
Unsupervised cell-type identification asks a model to group individual cells into populations with shared identity without any labels, which is hard when cell types are closely related. Most existing clustering methods look only at the intrinsic structure of cells (who is similar to whom) and ignore the fact that cell types are biologically defined by specific marker genes and gene regulatory relationships. The paper's goal is to fix that by explicitly learning how cells and genes are associated with one another, so that the learned cell representations carry biologically meaningful information rather than just geometric similarity.
Key Contributions
- A contrastive distribution alignment module that exploits topological tissue information (the cell graph) to uncover reliable intrinsic cellular structures. It is designed to be applicable to both scRNA-seq and spatial transcriptomics data.
- A refinement module that, instead of treating cells and genes independently, jointly models their interactions to identify underlying cell-gene associations across coherent cellular populations.
- A cross-view correlation contrastive objective that enforces consistency between the two refined embedding views and the cell adjacency structure.
- Extensive experiments on diverse scRNA-seq and spatial transcriptomics benchmarks, plus biological analyses (marker gene detection, trajectory inference) confirming that the recovered populations have coherent gene-expression signatures.
Main Findings
-
Consistent benchmark gains on scRNA-seq: Across 10 scRNA-seq datasets (Tumor, Diaphragm, Lung, Trachea, Human_ESC, Zeisel, Bladder, Limb_Muscle, Spleen, Baron_Human), averaged over five runs and measured by ACC, NMI, and ARI, scRCL outperformed all 13 compared baselines (scDeepCluster, scziDesk, GraphSCC, scGAE, scGAC, scNAME, scDFC, scDCCA, SCEA, AttentionAE-sc, scGAD, scMAE, scGCOT). Examples: on Human_ESC scRCL reached ACC 99.69, NMI 99.04, ARI 99.22; on Limb_Muscle 99.41 / 97.80 / 99.04; on Baron_Human 90.02 / 87.09 / 90.69; on the harder Tumor dataset 79.67 / 68.29 / 59.83.
-
Consistent benchmark gains on spatial transcriptomics: On Mouse Embryo E9.5, Mouse Brain Anterior, and Human Breast Cancer, scRCL achieved the best score on every metric reported (E9.5: 58.8 / 55.4 / 42.4; MBA: 51.9 / 72.3 / 50.7; HBC: 65.9 / 68.2 / 65.8) against SMGCN, GraphST, MuCoST, MAEST, and STAIG.
-
Contrast with prior cell-gene work: scGCOT also considers cell-gene relationships, but the authors argue it targets gene expression reconstruction and misses discriminative cellular structure, and it is limited to scRNA-seq without spatial context.
-
DLPFC spatial domains: On the LIBD human dorsolateral prefrontal cortex data with 12 tissue slices, scRCL's results were reported as averaged over the slices, and the visualization for slice #151507 showed more distinct and spatially coherent structures than the baselines.
-
Ablation on the three losses: Removing ℒ_HEA, ℒ_NDC, or ℒ_CVC degraded performance on Trachea, Zeisel, and Limb_Muscle. The largest drop came from removing ℒ_NDC (Trachea fell from 98.0 / 91.9 / 94.8 in the full model to 79.8 / 54.4 / 64.0).
-
Model structure ablation: The heterogeneous embedding design (one GCN encoder plus one MLP encoder) outperformed configurations using two GCNs or two MLPs, and adding the refinement module produced a significant improvement.
-
Biologically meaningful marker genes: On the Lung dataset, clusters obtained with the refinement module showed sharper marker-gene expression patterns than clusters without it. For cluster 10, the top markers were Cd3e, Cd3d, and Cd3g (established T cell markers), allowing annotation as T cells; without refinement the same cluster was marked by Eef1a1, a housekeeping gene not specific to T cells, indicating reduced interpretability. The authors report that the majority of top markers aligned with known cell-type markers in the CellMarker database.
-
Trajectory inference on DLPFC: UMAP visualizations of scRCL embeddings separated each cortical layer clearly, and the PAGA graph inferred a coherent linear trajectory from layer 1 through layer 6 to the white matter. Spatial-MGCN recovered a similar linear trajectory but failed to clearly separate layers 3, 4, and 5, and other methods showed layer overlap.
Methodology in Plain English
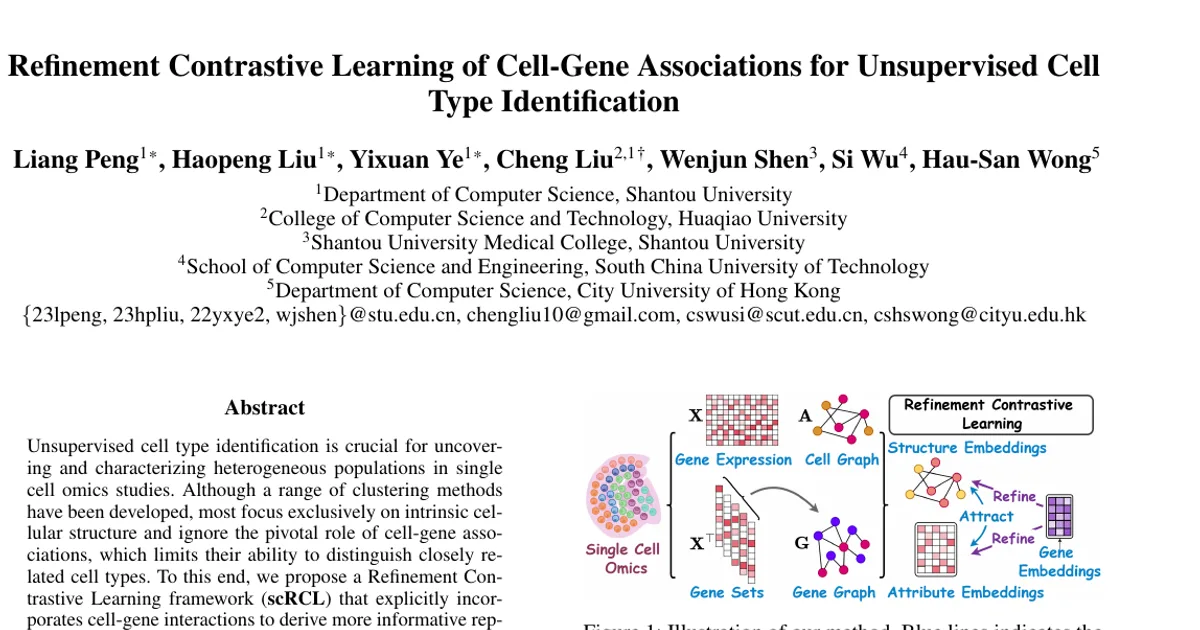
The input is a gene expression matrix (cells by genes). From it, the method builds two graphs: a cell graph (from spatial coordinates via k-nearest neighbors for spatial data, or estimated from expression similarity for scRNA-seq) and a gene graph built from the transposed expression matrix, where each row is a gene's profile across cells.
Two different encoders then read the expression data: a graph convolutional network that sees expression plus the cell graph, and a plain multi-layer perceptron that sees expression alone. This "heterogeneous" pair is deliberate — the two encoders have different inductive biases, so they capture complementary views.
Three objectives tie everything together. First, a distribution alignment loss uses symmetric Kullback-Leibler divergence to match the two encoders' outputs both globally (the whole cell population's embedding distribution) and locally (each individual cell's distribution). Second, a neighborhood contrastive loss pulls each cell's embeddings close to those of its graph neighbors while pushing them away from non-neighbors, measured again with symmetric KL divergence. Third, a refinement step introduces a gene encoder that reads the gene graph, then multiplies cell embeddings by a learned transformation and the gene embeddings — described as an inverse tri-matrix factorization — so each cell integrates information from its most relevant genes. A cross-view reconstruction loss encourages the cosine-similarity matrix between the two refined cell views to approximate the cell adjacency matrix plus self-connections.
After training, each cell's final representation is the concatenation of the two refined views, and plain k-means clustering on that representation produces the cell-type assignments. The two cell encoders are optimized by all three losses, while the gene encoder and refinement parameters are updated only by the cross-view correlation loss. Datasets and implementation details are stated to be in the supplementary file, so hyperparameter values are not reported in the main text.
Why This Matters
Impact on research: The work argues that cell-type identification should not be treated purely as a graph clustering problem. By making gene-gene structure and cell-gene associations first-class parts of representation learning, it offers a template that applies to both scRNA-seq and spatial transcriptomics rather than being tied to one modality. It also shows that better clustering accuracy can come with better biological interpretability — the clusters it recovers have cleaner marker-gene signatures, which matters for anyone who has to annotate cell populations.
Real-world applications:
- Annotating cell populations in single-cell atlases and tissue maps without labeled training data.
- Spatial domain identification in tissue sections, helping reveal layer and region structure in brain tissue (as demonstrated on DLPFC).
- Characterizing tumor microenvironments, where distinguishing closely related cell states is a recurring bottleneck.
- Developmental and clinical studies that depend on reliable marker gene detection and lineage/trajectory reconstruction (demonstrated with PAGA on cortical layers).
Industry relevance: These methods feed into drug discovery and precision medicine pipelines where single-cell profiling is used to find target cell populations and biomarker genes. A method that both clusters accurately and surfaces known marker genes reduces manual validation effort, and the released code (github.com/THPengL/scRCL) lowers the barrier to adoption in biotech and pharma computational biology groups.
Future Directions
- The paper's shared parameters α and β balance the three loss terms; their values, along with other implementation details, are deferred to the supplementary file, so sensitivity to these settings is not characterized in the main text.
- The ablation shows ℒ_NDC matters most on the tested datasets; whether that holds for datasets with weak or unreliable cell graphs is not established.
- The refinement module reduces to a linear transformation ℱ(W); whether richer, non-linear cell-gene mappings would improve representations further is left open.
- The paper mentions broader applicability across single-cell omics types (the alignment module is claimed to generalize to scRNA-seq and spatial transcriptomics), but experiments beyond those two modalities are not reported.
- Scalability is not reported — no runtime, memory, or cell-count scaling analysis appears in the provided content.
Target Audience
Computational biologists and bioinformatics researchers working on single-cell and spatial transcriptomics analysis; machine learning researchers interested in contrastive learning, graph representation learning, and multi-view alignment; and practitioners in biotech or pharma who need reliable unsupervised cell-type annotation tools. A reader needs prior familiarity with single-cell data structures and deep learning to follow the method section, making this an advanced-level read.
Authors’ abstract
Unsupervised cell type identification is crucial for uncovering and characterizing heterogeneous populations in single cell omics studies. Although a range of clustering methods have been developed, most focus exclusively on intrinsic cellular structure and ignore the pivotal role of cell-gene associations, which limits their ability to distinguish closely related cell types. To this end, we propose a Refinement Contrastive Learning framework (scRCL) that explicitly incorporates cell-gene interactions to derive more informative representations. Specifically, we introduce two contrastive distribution alignment components that reveal reliable intrinsic cellular structures by effectively exploiting cell-cell structural relationships. Additionally, we develop a refinement module that integrates gene-correlation structure learning to enhance cell embeddings by capturing underlying cell-gene associations. This module strengthens connections between cells and their associated genes, refining the representation learning to exploiting biologically meaningful relationships. Extensive experiments on several single-cell RNA-seq and spatial transcriptomics benchmark datasets demonstrate that our method consistently outperforms state-of-the-art baselines in cell-type identification accuracy. Moreover, downstream biological analyses confirm that the recovered cell populations exhibit coherent gene-expression signatures, further validating the biological relevance of our approach. The code is available at https://github.com/THPengL/scRCL.