Research
Quant-Arena: Benchmarking LLM Agents for Quantitative Trading Research
Overview Research area: Benchmarking and evaluating large language model (LLM) agents on end-to-end quantitative trading research over real stock-market data. Technical level: Advanced. The paper assu
- arXiv
- 2610.30113
- Published
- 2026-10-21
- Authors
- Houde Qian, Zheng Jiang, Wenyi Li, Chenxi Xu, Xinjie Lin, Yuzhao Peng, Ruoyu Han, Youjie Zheng, Kaisen Yang, Qinhuai Na, You Fu, Calvin Xiao
AI summary
Overview
Research area: Benchmarking and evaluating large language model (LLM) agents on end-to-end quantitative trading research over real stock-market data.
Technical level: Advanced. The paper assumes familiarity with cross-sectional equity signals, RankIC, Sharpe ratios, backtesting conventions, and LLM agent harnesses.
Scope in one sentence: Quant-Arena is a benchmark and public leaderboard in which nine frontier LLMs build feature and stock-scoring code from raw A-share order and trade records, iterate under a fixed budget on 2022–2023 data, and are then scored on a sealed 2024 out-of-sample year under realistic trading costs.
What This Paper Is About
Quantitative research is a loop: propose a market hypothesis, implement it as an executable signal, test it on history, and decide what to keep. Existing benchmarks score only isolated pieces of this loop — the correctness of trading code, the quality of formulaic factors, or single sequential trading decisions — so it has remained unclear whether LLMs can complete the whole loop and produce strategies that still work after the research period ends. Quant-Arena makes the entire research run the unit of evaluation, connecting raw feature construction to the realized, cost-adjusted performance of one frozen strategy on data the model never saw.
Key Contributions
-
An end-to-end quantitative research benchmark. Models construct features and stock-scoring code from raw Level-2 records (individual orders, trades, and order-book snapshots) through a controlled data interface, rather than drawing on a predefined factor library. Evaluation covers the joint effect of feature construction, signal combination, and strategy selection on the final portfolio.
-
A common research and financial evaluation protocol. Each run gets a bounded research budget (at most five candidate evaluations on 2022–2023), must commit one frozen strategy, and is assessed once on the sealed year 2024 under shared portfolio rules: a top-75 equal-weight long portfolio, a cash account with 100-share lots, order-dependent trading costs, and market impact estimated from a simulated order book.
-
An empirical analysis of nine frontier models. The authors run 38 iterative and 38 one-shot configurations across Claude Opus 5.5, Claude Sonnet 5.5, GPT-6 Astra, GPT-6 Sol, GPT-5.6 Terra, Gemini 3.8 Flash, DeepSeek V4.1 Flash, Kimi K3, and GLM-5.3, at every reasoning effort each model supports.
-
A public leaderboard open to any model or agent harness, which also lists Kepler-1, a proprietary strategy developed by Einsia AI, as a reference point.
Main Findings
-
Profitable strategies are rare, and beating the market is rarer. Thirteen of the 38 iterative configurations earn a positive annualized return, but only GPT-6 Sol at medium effort exceeds the 17.1% gross equal-weight market return, at 18.4% (+1.4 pp). The abstract and conclusion state that no model beats the equal-weight market in 2024; the per-configuration table reports this single exception.
-
The best overall score belongs to GPT-6 Astra at xhigh effort, with a total score of 51.29 (in-sample 53.94, out-of-sample 50.16), 10.7% annualized return, −6.3 pp excess return, RankIC 0.101, Sharpe 0.86, and maximum drawdown of −6.8%.
-
Higher reasoning effort does not reliably help. For six of the nine models the best effort is not the highest supported: Opus scores 44.28 at medium versus 41.39 at max, Gemini 43.04 versus 35.39, and Kimi 38.31 at low versus 31.86 at max. The spread across one model's efforts reaches 14.49 points (Terra), close to the 18.77-point range between the nine highest-effort scores. Effort appears to act through discrete design choices — Astra's xhigh and max runs add a market-state filter and hold cash on 70–75% of days, while its low, medium, and high runs stay roughly 47–48% invested.
-
Ranking skill does not translate into portfolio profit. For Opus, Sonnet, Gemini, DeepSeek, Kimi, and GLM, next-day returns by score decile form a hump: the second or third decile earns the most (24–33 bp per day) and returns fall toward the top decile, leaving highest-minus-lowest spreads between −10.5 and +4.7 bp. RankIC and profit are nearly uncorrelated across the 38 iterative runs (Spearman 0.09); GLM has RankIC 0.046 with −7.8% ARR, while Opus at medium effort has RankIC −0.002 with 4.4% ARR.
-
Astra's lead comes from market timing, not stock picking. Its program scores stocks only when the median five-session and twenty-session log returns of the universe are both positive, and otherwise holds cash. The rule first buys on 28 February 2024, so Astra's NAV is exactly 1.000 when the market bottoms at 0.704 on 6 February, and its January–February drawdown is −1.7% against −29.6% for the market. It ends the year at 1.107 versus 1.170 for the market. The cost is capped upside: Astra captures 16% of the market's rebound from the February low, against 73% for Terra.
-
Iteration raises scores more reliably than returns. Pairing each model's best iterative and one-shot configurations, the mean score rises from 36.47 to 43.55 (gains from 0.69 for Sonnet to 18.99 for Sol), but sealed-period annualized return improves for only four of nine models (Sol, Astra, Kimi, DeepSeek, by 6.2 to 16.2 pp), for a mean gain of just 2.9 pp. The mean gain in the research-period score is 10.36 points versus 5.67 out of sample, and iterative best configurations lose 12.4 points between the two windows against 7.7 for one-shot runs.
-
Research progress comes early and plateaus. Mean best-so-far gains over the first valid candidate are 0, 14.4, 16.7, 29.1, and 36.5 pp at candidate indices one to five, but the median gain is only 6.5 pp at the second candidate and 7.0 pp at the end of the run. Two runs (DeepSeek and Sol, improving 57.1 and 50.7 pp from first candidates near −44 and −45 pp excess return) drive the mean; without them the mean final gain is 6.5 pp.
-
Models share a trading style that does not separate winners from losers. Eight of nine models tilt toward smaller stocks, seven toward higher book-to-price, and most toward lower volatility and turnover. Opus and DeepSeek instead lean toward higher volatility (+0.54 and +0.46) and turnover (+0.56 and +0.57), while Terra stays within 0.11 of the market on every dimension. Similar tilts end in different places: Astra (book-to-price +0.96, volatility −1.05) finishes at 1.11 and Sonnet (+0.54, −0.64) at 0.88.
-
Kepler-1 converts signal into account value far better than any model. It scores 77.56 and ends 2024 at 1.93 versus 1.17 for the market, despite a lower RankIC (0.085 versus Astra's 0.101), with a Sharpe ratio of 2.98 against 1.89 for the best model. Four models finish above their starting capital: Astra (1.11), Sol (1.09), Terra (1.08), and Opus (1.04).
-
One-shot runs are weaker and more volatile. The median one-shot configuration scores 31.61, only 4 of 38 exceed 40 points (against 21 in the iterative setting), and six have positive sealed-period return, none above the market. For eight of nine models the best one-shot effort is not the highest; Terra spans 21.16 points, from 42.14 with no reasoning to 20.98 at max. At matched efforts, iterative runs beat one-shot runs for all nine models (mean 40.88 versus 30.18) and across all 38 matched cells win on score in 34, on ARR in 26, and on RankIC in 28.
-
Models largely converge on correlated signals but pick different tails. Mean pairwise rank correlation is 0.47, but mean Top-75 Jaccard overlap is only 6.1% (maximum 35.6%). Opus and DeepSeek are the most similar pair (correlation 0.94, overlap 35.6%); Terra is the most distinct, with a mean correlation of 0.14 against the other eight.
Methodology in Plain English
The researchers built a controlled sandbox on real A-share data covering a fixed universe of 3,042 stocks, with missing and delisted names retained. A model is given a research objective, documentation, and a date-scoped Python data interface; it writes a program that turns raw daily and Level-2 market data into features and then into daily stock scores. During research it may run at most five candidate strategies on 2022–2023 and receives only aggregate feedback: return, signal and coverage statistics, and execution errors. It cannot see anything about 2024.
At the end of research the program, its environment, and its declared features are frozen. A separate evaluator applies that program once to 2024, buying the top 75 ranked stocks equal-weighted through a simulated cash account with 100-share lot sizes, trading costs, and market impact from a simulated order book; idle cash earns zero. Scoring combines realized excess return (the largest weight) with long-only Sharpe, long–short Sharpe, RankIC, its annualized information ratio, and turnover, plus a diversity term that rewards using up to 32 distinct, detected feature clusters. The published in-sample score weights quality 90% and diversity 10%; the final score is 0.3 in-sample plus 0.7 out-of-sample, with the out-of-sample combination rule unpublished. The authors then compared nine models at every supported reasoning effort in both an iterative (feedback-enabled) and a one-shot setting, and drilled into decile returns, account paths, candidate trajectories, and style exposures.
Why This Matters
Impact on research. The paper shifts the unit of evaluation from a formula, a snippet of code, or a single trade to the whole research loop and its out-of-sample financial consequence. Its central negative result — that average rank correlation and realized portfolio return are nearly uncorrelated, and that the stocks a model ranks highest can underperform middle-ranked ones — is a concrete warning about how LLM-generated quant work has been judged. The sealed-year protocol, bounded evaluation budget, and frozen submission directly address selection bias from repeated backtesting.
Real-world applications:
- Evaluating and procuring AI research agents for systematic equity strategies, using profitability under costs rather than code correctness as the criterion.
- Stress-testing internal LLM quant tools for overfitting to a research window before any capital is committed.
- Auditing whether an agent's apparent edge comes from genuine stock selection or simply from market timing and cash management.
- Serving as an open leaderboard where vendors, hedge funds, and academics can compare harnesses and models under identical rules.
Industry relevance. The gap between the best model (51.29) and Kepler-1 (77.56), and between their Sharpe ratios (1.89 versus 2.98), quantifies how far general-purpose agents remain from a production-grade signal-to-portfolio pipeline. The finding that iteration mostly repairs an obviously broken first draft and then plateaus, and that more reasoning effort is as likely to hurt as help, is directly useful to anyone allocating compute or budget to agentic research systems.
Future Directions
- Closing the gap between ranking skill and portfolio value: designing agents or objectives that explicitly optimize the extreme tail (the top-75 names) rather than average cross-sectional correlation, since the decile analysis shows profits live at the head of the ranking.
- Understanding why higher reasoning effort is non-monotonic and sometimes harmful, and whether effort should be spent on hypothesis search, code repair, or regime detection.
- Extending the sealed-assessment protocol to additional markets, universes, and horizons, and testing whether the market-timing behavior Astra discovered is a generalizable skill or an artifact of the 2024 A-share path.
- Exploring the iteration plateau: since most gains arrive by the second candidate and better models' iterative runs lose more between windows than one-shot runs (12.4 versus 7.7 points), the field needs methods that make repeated feedback improve out-of-sample rather than in-sample performance.
Target Audience
Researchers and engineers working on LLM agents for finance and automated scientific discovery; quantitative researchers and portfolio managers assessing whether AI agents can be trusted with strategy development; benchmark designers interested in sealed evaluation and selection-bias control; and model developers who want to know where frontier systems still fail on long-horizon, feedback-driven, executable research tasks.
Authors’ abstract
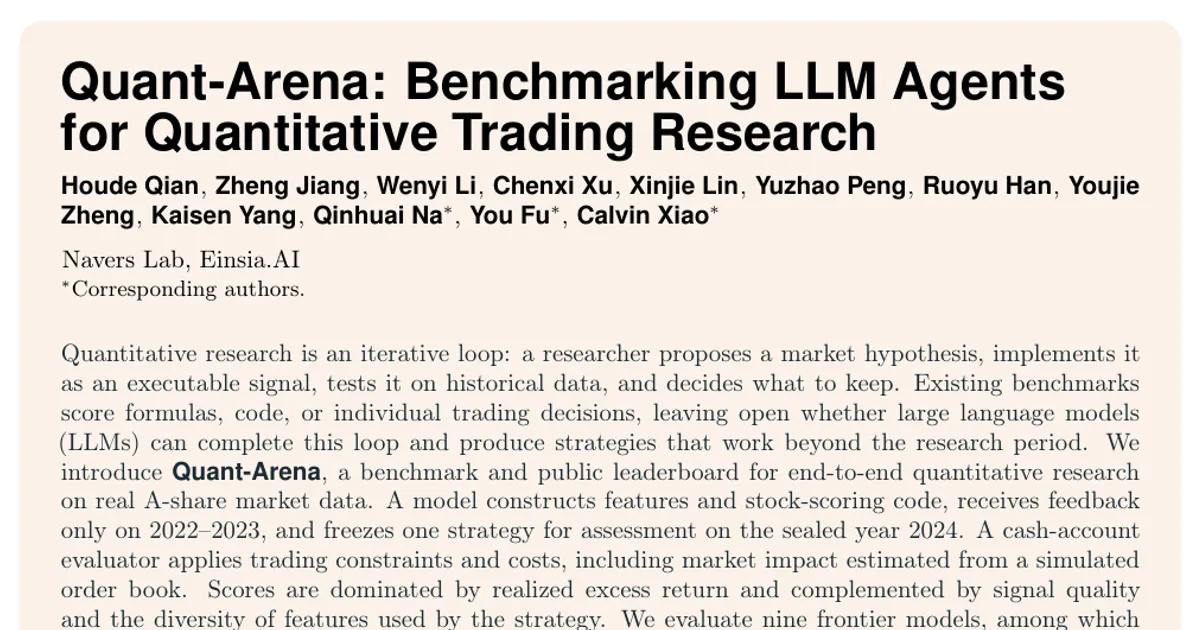
Quantitative research is an iterative loop: a researcher proposes a market hypothesis, implements it as an executable signal, tests it on historical data, and decides what to keep. Existing benchmarks score formulas, code, or individual trading decisions, leaving open whether large language models (LLMs) can complete this loop and produce strategies that work beyond the research period. We introduce Quant-Arena, a benchmark and public leaderboard for end-to-end quantitative research on real A-share market data. A model constructs features and stock-scoring code, receives feedback only on 2022--2023, and freezes one strategy for assessment on the sealed year 2024. A cash-account evaluator applies trading constraints and costs, including market impact estimated from a simulated order book. Scores are dominated by realized excess return and complemented by signal quality and the diversity of features used by the strategy. We evaluate nine frontier models, among which GPT-6 Astra scores highest; yet no model beats the equal-weight market in 2024. Quant-Arena is open to submissions from any model or agent harness.