Research
ParseBench: A Document Parsing Benchmark for AI Agents
Overview Research area: Document parsing evaluation for AI agents — a computer vision / document understanding benchmark covering enterprise documents. Technical level: Intermediate. The paper is read
- arXiv
- 2604.08538
- Published
- 2026-04-09
- Authors
- Boyang Zhang, Sebastián G. Acosta, Preston Carlson, Sacha Bron, Pierre-Loïc Doulcet, Simon Suo
AI summary
Overview
Research area: Document parsing evaluation for AI agents — a computer vision / document understanding benchmark covering enterprise documents.
Technical level: Intermediate. The paper is readable without deep math, but understanding the metrics (structure matching, rule-based scoring, IoA thresholds) benefits from some familiarity with document parsing and benchmark evaluation.
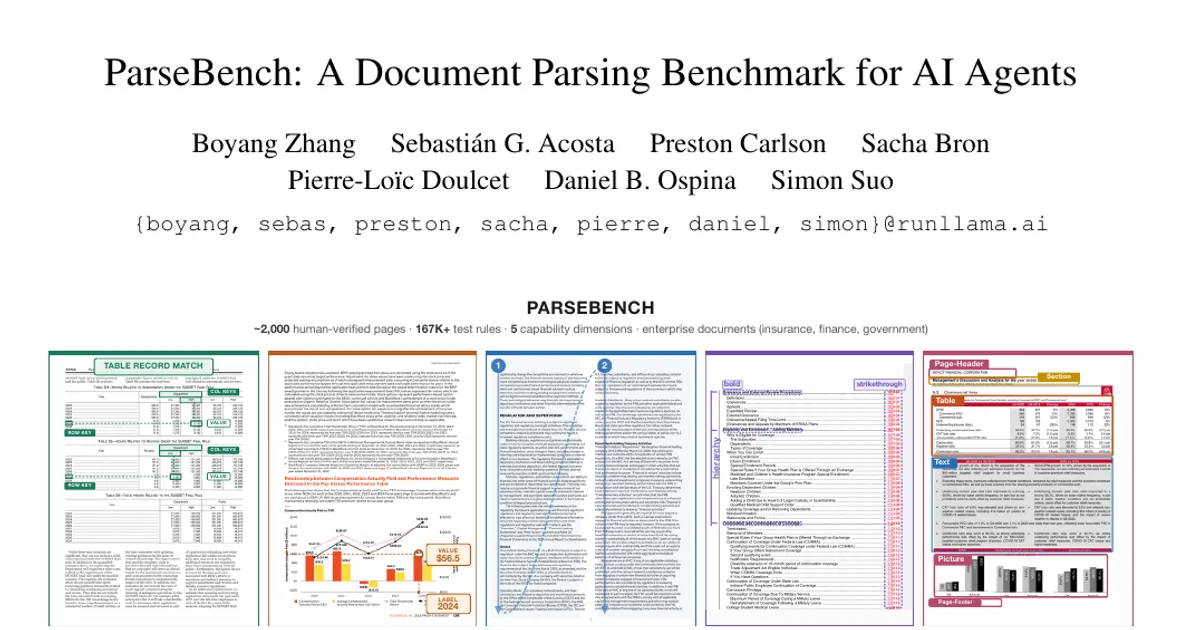
Scope (one sentence): ParseBench is a new benchmark of roughly 2,000 human-verified enterprise document pages that evaluates 14 parsing methods across five agent-critical capability dimensions using semantic-correctness metrics rather than text-similarity metrics.
What This Paper Is About
Existing document parsing benchmarks were built for older goals — making PDFs searchable for humans or extracting fixed fields from known templates — and they use narrow document collections plus text-similarity metrics that miss the failures that actually break AI agents. The authors argue that what matters now is semantic correctness: a parser must preserve table structure, exact chart values, meaning-bearing formatting, reading order, and traceable source locations well enough for an agent to act on the output. ParseBench is their attempt to measure that, using enterprise documents from insurance, finance, and government.
Key Contributions
-
A new benchmark of ~2,000 human-verified pages. ParseBench totals 2,078 annotated pages drawn from 1,180 documents, with 169,011 test rules overall, sourced from publicly available enterprise documents spanning insurance, finance, government, and other domains.
-
Five capability dimensions tied to agent failure modes. The benchmark is organized around tables, charts, content faithfulness, semantic formatting, and visual grounding, each with its own ground-truth format and metrics.
-
Evaluation designed for semantic correctness rather than text overlap. Tables are scored by structural record matching (TableRecordMatch, combined with GriTS into GTRM), charts by exact data-point verification (ChartDataPointMatch), and text and layout dimensions by rule-based binary tests (Content Faithfulness Score, Semantic Formatting Score, Element Pass Rate).
-
A 14-method empirical comparison. The paper evaluates vision-language models, specialized document parsers, and two LlamaParse configurations, showing that no single method is consistently strong across all five dimensions, with LlamaParse Agentic leading overall at 84.88%.
Main Findings
-
No method dominates across all dimensions. The benchmark "reveals a fragmented capability landscape": VLMs are competitive on content extraction but weak on chart recovery and visual grounding, while specialized parsers offer stronger grounding support but often underperform on charts and semantic formatting.
-
Overall leaderboard: LlamaParse Agentic scores 84.88% overall, followed by LlamaParse Cost Effective at 71.89%, Gemini 3 Flash at 71.0%, and Reducto at 67.8%.
-
Tables are competitive at the top. LlamaParse Agentic leads at 90.74% and Gemini 3 Flash reaches 89.9%; the authors say the main differentiation appears in the long tail of adversarially hard documents such as deeply nested headers, merged cells, and cross-page continuity.
-
Charts are the most polarizing dimension. LlamaParse Agentic leads at 78.11%; only five providers exceed 50%, and most specialized parsers score below 6% (for example, Google Cloud Doc AI at 1.4%, Azure at 1.6%, Extend at 1.6%, Dots OCR 1.5 at 0.9%, AWS Textract at 6.0%).
-
Content faithfulness is the most table-stakes dimension. The top scores are Dots OCR 1.5 at 90.0% and LlamaParse Agentic at 89.68%; the authors note that even the strongest systems reach only around 90%, leaving non-trivial error rates for workflows where parsing errors propagate into agent decisions.
-
Semantic formatting is a clear separator. LlamaParse Agentic leads at 85.24%, followed by LlamaParse Cost Effective at 73.04% and Qwen 3 VL at 64.2%; several parsers score near the bottom (Docling at 1.0%, AWS Textract at 3.7%).
-
Visual grounding is hard for single-pass proprietary VLMs. GPT-5 Mini (6.2%) and Haiku 4.5 (6.7%) both score below 10%, while LlamaParse Agentic leads at 80.62%, followed by Azure Doc Intelligence at 73.8% and AWS Textract at 70.4%.
-
Grounding results carry caveats. Qwen 3 VL's grounding score (55.2%) uses a separate layout-only pipeline and excludes 4 pages where that pipeline failed; Docling's score (66.1%) excludes 13 pages with pipeline failures.
-
Existing benchmarks leave the gap open. The paper's comparison table classifies ParseBench as the only listed benchmark marked as supported across all five dimensions on enterprise documents, versus subtask benchmarks like PubTabNet (568K, Academic), FinTabNet (113K, Financial), DocLayNet (80K, Mixed), and ChartQA (21K, Web), and end-to-end benchmarks like OmniDocBench (1,355, Mixed), OCRBench v2 (10K, Mixed), and olmOCR-Bench (1,402, Academic).
Methodology in Plain English
The authors built the benchmark in four stages per dimension: crawl public documents from online sources such as insurance filings, financial reports, and government documents; detect relevant pages using ML-based detection such as DocLayout models; categorize pages along difficulty axes specific to each dimension; and sample in a stratified way so the benchmark spans easy to adversarially hard cases.
Annotation runs in two passes. A frontier vision-language model produces an initial annotation from the source PDF page, then human reviewers verify and correct it. Ground truth differs by dimension: full HTML tables for tables, structured data points with value, labels, and tolerance for charts, Markdown transcriptions for content faithfulness and semantic formatting, and bounding boxes with class labels for visual grounding.
Evaluation changes per dimension rather than using one text-similarity number:
-
Tables use TableRecordMatch, which treats a table as a bag of records (each row keyed by its column headers), matches ground-truth records to predicted records, and scores matched pairs by binary cell-level agreement normalized over the union of keys. It is insensitive to row and column order but heavily penalizes dropped or transposed headers. This is averaged with GriTS into GTRM. Tables with discontiguous or multi-sided headers that TableRecordMatch cannot capture well are flagged as
trm_unsupportedand reported with GriTS instead. -
Charts are not annotated with full ground-truth tables. Instead, up to 10 spot-check data points per chart are annotated, each with a value and one or more labels, plus a tolerance (exact for charts with explicit labels, default 1% relative for charts without). ChartDataPointMatch is the proportion of annotated points verified in the parser's output table, making it robust to table orientation and numeric formatting differences.
-
Content faithfulness transcribes each document into complete Markdown ground truth and automatically generates rules from it, covering omissions, hallucinations, duplication, and reading-order violations. Word-, sentence-, and digit-level rules are used, with digit frequency comparisons catching common OCR errors. Scores are aggregated in two averaging levels (per rule type, then per document category) so document length does not dominate; the composite Content Faithfulness Score weights text correctness at 1.0 and reading order at 0.5.
-
Semantic formatting checks strikethrough, superscript, subscript, and bold (with italic, underline, and highlight evaluated additionally) through positive and negative rules, combined with a weighted harmonic mean where β = 0.5 penalizes false styling more heavily than missed styling. Title accuracy, LaTeX, and code blocks are also scored, with LaTeX and code down-weighted to 1/5 because they appear in only a small fraction of documents.
-
Visual grounding requires localization, classification, and attribution to all pass for the same element (Element Pass Rate). Localization uses asymmetric intersection-over-area with thresholds of IoA(GT, Pred) ≥ 0.50 and IoA(Pred, GT) ≥ 0.20; attribution uses IoA ≥ 0.30 for candidate gathering and token-level F1 ≥ 0.80 (or recall for chart-like "explicit" cases). Labels are collapsed into a shared set of Text, Table, Picture, Page-Header, and Page-Footer.
Methods were run at a comparable low-cost operating point of roughly one cent per page where possible; proprietary VLMs used minimal reasoning/thinking settings, and open-weight VLMs (Qwen 3 VL 8B, Dots OCR 1.5) ran on NVIDIA H100 GPUs via vLLM on Modal. The dataset is released on HuggingFace and the evaluation code on GitHub.
Why This Matters
Impact on research. The paper argues that benchmark design itself is a bottleneck: metrics that reward surface-level text similarity penalize harmless formatting differences while missing broken table structure, wrong chart values, dropped content, and missing grounding. By separating five dimensions and releasing an extensible dataset and metric suite, it gives the field a diagnostic tool that can pinpoint where a parser fails rather than producing a single aggregate score. The authors explicitly invite independent replication and extension, writing that stronger external results would validate the benchmark's usefulness rather than undermine it.
Real-world applications:
- Insurance claims processing — a broad slice of the table data comes from SERFF filings (274 pages, 54.5% of table pages); a misaligned header or merged-cell error can silently produce the wrong value in an automated approval.
- Financial analysis — parsing financial reports where charts must become structured data rather than raw text, and where mistranscribing a value such as a 2.0% interest rate as 0.2% can throw off a downstream model.
- Government and regulatory submissions — high-stakes documents requiring auditability, which is why visual grounding (tracing each element to its source region) is a first-class dimension.
- Enterprise data entry and indexing — replacing manual transcription of charts and tables with machine-readable output in data-heavy fields the paper names: finance, energy, healthcare, and marketing.
Industry relevance. The benchmark compares commercial products directly (AWS Textract, Google Cloud Doc AI, Azure Doc Intelligence, Reducto, Extend, LandingAI) alongside open-source pipelines (Docling), open-weight models (Qwen 3 VL 8B, Dots OCR 1.5), and proprietary VLMs (GPT-5 Mini, Haiku 4.5, Gemini 3 Flash). The cost-aware setup at roughly one cent per page, and the split between LlamaParse Cost Effective and Agentic configurations, frames accuracy as a throughput-versus-quality tradeoff that production teams actually face.
Future Directions
-
Closing the chart gap. Most specialized parsers score below 6% on charts, and only five providers exceed 50%. The paper identifies chart-to-table extraction as the dimension where current systems most often either skip charts or emit raw OCR text.
-
Extending the benchmark along three axes. The authors state the benchmark is designed to be extended in data annotation, evaluation metrics, and provider integrations, and explicitly encourage external replication.
-
Covering table semantics that TableRecordMatch misses. Tables with multiple discontiguous header rows or headers on both top and side are currently flagged
trm_unsupportedand scored with GriTS only; the paper notes these cases are identified by manual review. -
Improving grounding robustness for failing pipelines. Qwen's separate layout-only pipeline failed to return usable output on 4 pages and Docling's on 13 pages in the visual grounding dimension, both excluded from reported scores — a gap the paper acknowledges but does not resolve.
Target Audience
This paper is most useful to engineers and researchers building document parsing or extraction systems for enterprise automation, benchmark designers who need alternatives to text-similarity metrics, and product teams evaluating commercial parsers or VLMs for high-stakes workflows such as insurance, finance, and government processing. It is also relevant to anyone studying agent reliability, since the framing centers on parsing errors propagating into downstream agent decisions.
Authors’ abstract
AI agents are changing the requirements for document parsing. What matters is \emph{semantic correctness}: parsed output must preserve the structure and meaning needed for autonomous decisions, including correct table structure, precise chart data, semantically meaningful formatting, and visual grounding. Existing benchmarks do not fully capture this setting for enterprise automation, relying on narrow document distributions and text-similarity metrics that miss agent-critical failures. We introduce \textbf{ParseBench}, a benchmark of ${\sim}2{,}000$ human-verified pages from enterprise documents spanning insurance, finance, and government, organized around five capability dimensions: tables, charts, content faithfulness, semantic formatting, and visual grounding. Across 14 methods spanning vision-language models, specialized document parsers, and LlamaParse, the benchmark reveals a fragmented capability landscape: no method is consistently strong across all five dimensions. LlamaParse Agentic achieves the highest overall score at \agenticoverall\%, and the benchmark highlights the remaining capability gaps across current systems. Dataset and evaluation code are available on \href{https://huggingface.co/datasets/llamaindex/ParseBench}{HuggingFace} and \href{https://github.com/run-llama/ParseBench}{GitHub}.