Research
NASTaR: NovaSAR Automated Ship Target Recognition Dataset
Overview Research area: Computer vision / remote sensing — synthetic aperture radar (SAR) ship automatic target recognition (ATR), with a focus on dataset construction and benchmarking. Technical leve
- arXiv
- 2512.18503
- Published
- 2025-12-20
- Authors
- Benyamin Hosseiny, Kamirul Kamirul, Odysseas Pappas, Alin Achim
AI summary
Overview
- Research area: Computer vision / remote sensing — synthetic aperture radar (SAR) ship automatic target recognition (ATR), with a focus on dataset construction and benchmarking.
- Technical level: Intermediate. The concepts are accessible, but readers will get the most from it with some familiarity with SAR imagery, AIS transponder data, and standard deep learning classification pipelines.
- Scope: The paper builds and releases NASTaR, the first publicly available benchmark dataset for fine-grained ship-type classification built from real S-band NovaSAR imagery with AIS-derived labels, and validates it with standard deep learning classifiers.
What This Paper Is About
Publicly available SAR ship datasets are almost all built from X-band or C-band imagery and mostly target coarse detection or two-way classification, leaving S-band (used by satellites such as NovaSAR and NiSAR) without a dedicated benchmark. The authors address this gap by constructing NASTaR: 3415 ship patches cropped from 624 NovaSAR images of the North Sea and the Danish straits, with ship types labeled by matching each patch to AIS records from the Danish Maritime Authority. The goal is to give researchers a standardised, real-S-band testbed for fine-grained ship-type classification, inshore/offshore separation, and ship-wake analysis, then measure how well existing deep learning models perform on it.
Key Contributions
- A new S-band SAR benchmark dataset. NASTaR contains 3415 ship patches extracted from NovaSAR Stripmap imagery (6 m resolution, ground-range detected), acquired over the North Sea and Danish straits between November 2023 and June 2024 across 624 images. After filtering, the final dataset is 1891 ship patches (703 inshore, 1188 offshore).
- AIS-derived, fine-grained labels with 23 unique classes. Ship types come from Danish Maritime Authority AIS records filtered to a 100-second window around each acquisition, alongside auxiliary attributes such as speed over ground (SOG), heading, length, width, and distance to shore. The dataset includes an inshore/offshore split based on a 500 m distance-to-land threshold.
- A dedicated ship-wake subset. 500 wake patches (1024×1024 pixels, i.e. 2560×2560 m² on the ground) were retained from 1151 candidates for ships moving faster than 1 m/s, with the ship placed in a corner rather than the centre to capture the extended wake. This is described as the first publicly available dataset using real S-band wake patterns for ship identification.
- A benchmark suite across five classification scenarios. ResNet and ResNeXt variants, DenseNet121, EfficientNet, and Vision Transformers were evaluated under ten-fold cross-validation, with results reported for the combined, offshore-only, and inshore-only subsets, plus an experiment testing whether wake patches outperform ship patches for the three hardest classes.
Main Findings
- Four-class classification is the hardest scenario. Combining Fishing, Passenger, Cargo, and Tanker yields 61.9 ± 1.5 overall accuracy (OA), 58.1 ± 2.5 average accuracy (AA), 64.5 ± 1.8 average precision (APr), and 59.6 ± 2.1 average F1 (AF1) on the combined inshore/offshore set.
- Fewer classes produce clear gains. Fishing/Cargo reaches 88.5 ± 3.3 OA, Fishing/Other reaches 87.6 ± 2.9 OA, the three-class Fishing/Cargo/Tanker scenario reaches 70.8 ± 2.4 OA, and Cargo/Tanker reaches 75.4 ± 1.6 OA on the combined set.
- Offshore results beat inshore results. Offshore (Table II) gives 91.1 ± 2.0 OA for Fishing/Other, 91.9 ± 3.4 for Fishing/Cargo, 74.6 ± 1.8 for Cargo/Tanker, 70.7 ± 3.1 for the three-class scenario, and 61.6 ± 1.5 for four classes. Inshore (Table III) gives 78.9 ± 6.8, 79.2 ± 5.6, 75.0 ± 9.1, 68.5 ± 2.1, and 62.6 ± 1.6 respectively.
- Offshore results are more stable, inshore results more variable. Standard deviations are consistently lower offshore across the ten-fold cross-validation; the authors attribute the inshore variability to land and infrastructure backscatter, land–sea boundary confusion, multipath and shadowing, the absence of wakes inshore, and the smaller number of inshore samples.
- Wakes carry discriminative information. For the three hardest classes (Cargo, Passenger, Tanker), models trained on wake patches achieved 57.71 ± 2.01 OA, 48.05 ± 2.71 AA, 58.68 ± 4.74 APr, and 48.78 ± 3.63 AF1, versus 52.38 ± 4.11, 42.90 ± 3.47, 48.79 ± 5.96, and 41.94 ± 4.16 for the corresponding main ship patches.
- Tankers are the main source of error. In the Cargo/Tanker confusion matrix (Table S4), tanker recall is 0.3700 ± 0.0515 while cargo recall is 0.9434 ± 0.0270, giving tanker an F1 of 0.4964 ± 0.0444. This pattern persists in the three-class and four-class confusion matrices.
- Filtering removes a large share of samples, especially fishing vessels. Removing duplicates eliminated 198 inshore and 5 offshore patches; low-quality filtering eliminated 1059 inshore and 262 offshore patches. The largest reduction is for fishing vessels, which the authors attribute to their smaller size and weaker or partially obscured S-band signatures.
- Cargo ships dominate after filtering, particularly offshore, and also form the majority of the wake subset, followed by tanker and passenger ships. Fishing vessels are the most prevalent class in the initial, unfiltered dataset.
- AIS–SAR matching uncertainty stays inside the patch footprint. With a 10-second AIS reporting interval, displacement is about 77 m at 15 knots and about 154 m at 30 knots; adding roughly 10 m GPS error and under 5 m NovaSAR geolocation error (after manual tie-point affine correction) gives total uncertainty of about 78.4 m at 15 knots and about 154.7 m at 30 knots — well within the 1280×1280 m patch.
- Performance is lower than on higher-resolution datasets. The authors attribute this to the smaller dataset size and the moderate resolution of NovaSAR Stripmap imagery, while noting gains over earlier S-band studies that relied heavily on simulations.
Methodology in Plain English
The authors started from 624 NovaSAR Stripmap scenes (6 m resolution, S-band at 3.2 GHz) covering the North Sea and Danish straits from November 2023 to June 2024. To label ships, they pulled AIS records from the Danish Maritime Authority, keeping only messages that fell inside the image footprint and within 100 seconds of the acquisition time, and keeping the closest AIS record per vessel. Each vessel position was mapped into image coordinates and a 512×512-pixel crop (1280×1280 m²) was cut around it.
Two cleaning stages followed. Duplicate removal handled overlapping patches: where several ships of the same class sat close together, one representative patch was kept; where labels were ambiguous, all patches in that region were discarded. Quality filtering then removed patches with invisible or severely degraded ship signatures. Distance to the nearest landmass (from Natural Earth maps) was computed for every patch and a 500 m threshold split the data into inshore and offshore groups. A separate wake extraction relied on AIS speed over ground above 1 m/s to flag likely wake generators, with the final 500 wake patches cropped at 1024×1024 pixels.
For benchmarking, each patch was converted to intensity format, normalised to [0,1], and resampled to 5×5 m effective pixel spacing, halving the spatial dimensions. Five classification scenarios were built from Fishing, Cargo, Tanker, and Passenger using ResNet and ResNeXt variants, DenseNet121, EfficientNet, and Vision Transformers. Training used PyTorch with Adam, weighted cross-entropy to handle class imbalance, batch size 16, learning rates between 0.0001 and 0.0005, and linear decay after five epochs without validation improvement. Ten-fold cross-validation with a 70/30 train-test split per fold produced the reported means and standard deviations.
Why This Matters
NASTaR fills a documented gap: no prior public dataset provides real S-band SAR imagery for fine-grained ship-type classification, and no prior public dataset uses real S-band wake patterns for ship identification. Because S-band trades some spatial resolution for wider swath coverage and better signal-to-noise than X- or C-band, it is attractive for large-scale maritime surveillance — but without a benchmark, models cannot be compared or cross-band transfer studied.
Real-world applications:
- Maritime domain awareness and traffic monitoring, particularly distinguishing cargo from tanker traffic in high-density or geopolitically sensitive regions, which the authors describe as an ongoing research challenge.
- Illegal, unreported, and unregulated (IUU) fishing detection, where fishing vessels are small, erratic, and often operate in remote areas or with tracking disabled.
- Wake-based motion inference, using the dedicated wake subset to help identify vessel type and behaviour where hull shape alone is insufficient.
- Cross-band and multi-platform model development, providing a reference point for testing whether features learned on X- or C-band data transfer to S-band sensors.
Industry relevance: the dataset was built with NovaSAR imagery provided by Surrey Satellite Technology Ltd. (SSTL) and Airbus UK, and the work was supported by an EPSRC Impact Acceleration Account and the Dstl DASA Defence Rapid Impact Open Call — indicating direct interest from the satellite-operations and defence sectors. The benchmark code is released on GitHub and the dataset via a University of Bristol DOI, under a CC BY-NC-SA 4.0 license.
Future Directions
- Cross-domain and multi-platform learning: assessing how well features transfer across different SAR frequencies and satellite platforms.
- Tailored deep learning architectures designed specifically to improve the reported NASTaR benchmark results, rather than relying on general-purpose classifiers.
- Deeper investigation of wake patterns and their relationship to sea surface characteristics, and how that relationship can support maritime activity monitoring.
- Mitigating the tanker recall problem and the inshore/offshore performance gap, given that tanker recall (0.3700 ± 0.0515 in the Cargo/Tanker scenario) and inshore variability remain the dataset's clearest weak points, and that the inshore subset is smaller (703 patches versus 1188 offshore).
Target Audience
Researchers and engineers working on SAR-based maritime surveillance, ship ATR, and remote sensing deep learning who need a standardised S-band benchmark; practitioners in defence, maritime safety, and fisheries monitoring evaluating whether satellite SAR can support operational classification; and machine learning researchers interested in small, imbalanced, class-overlapping remote sensing datasets or in cross-sensor and cross-band generalisation.
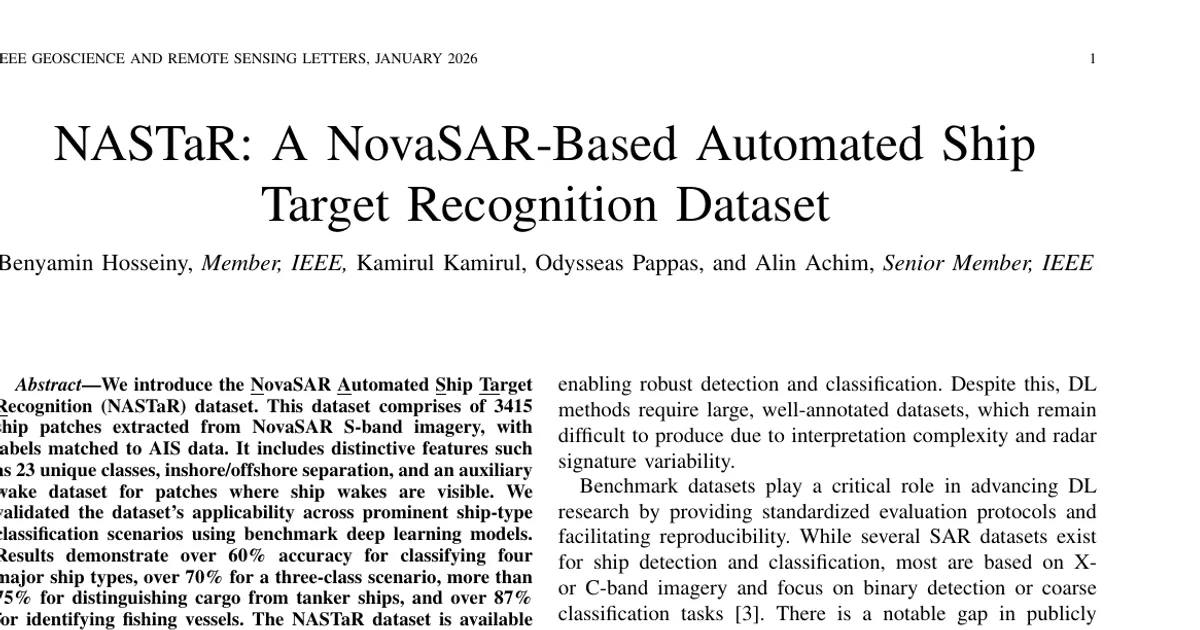
Authors’ abstract
Synthetic Aperture Radar (SAR) offers a unique capability for all-weather, space-based maritime activity monitoring by capturing and imaging strong reflections from ships at sea. A well-defined challenge in this domain is ship type classification. Due to the high diversity and complexity of ship types, accurate recognition is difficult and typically requires specialized deep learning models. These models, however, depend on large, high-quality ground-truth datasets to achieve robust performance and generalization. Furthermore, the growing variety of SAR satellites operating at different frequencies and spatial resolutions has amplified the need for more annotated datasets to enhance model accuracy. To address this, we present the NovaSAR Automated Ship Target Recognition (NASTaR) dataset. This dataset comprises of 3415 ship patches extracted from NovaSAR S-band imagery, with labels matched to AIS data. It includes distinctive features such as 23 unique classes, inshore/offshore separation, and an auxiliary wake dataset for patches where ship wakes are visible. We validated the dataset applicability across prominent ship-type classification scenarios using benchmark deep learning models. Results demonstrate over 60% accuracy for classifying four major ship types, over 70% for a three-class scenario, more than 75% for distinguishing cargo from tanker ships, and over 87% for identifying fishing vessels. The NASTaR dataset is available at https://doi.org/10.5523/bris.2tfa6x37oerz2lyiw6hp47058, while relevant codes for benchmarking and analysis are available at https://github.com/benyaminhosseiny/nastar.