Research
More Choices, Fewer Decisions: Ordinal-Scale Bias in JEV-like Direct-Decision Models
More Choices, Fewer Decisions: Ordinal-Scale Bias in JEV-like Direct-Decision Models Overview Research area: Reliability and bias analysis of direct-decision language models (JEV-style models that ret
- arXiv
- 2609.38827
- Published
- 2026-09-30
- Authors
- Tianxiang Gao, Jinzhe Li, Zhiyuan Li, Yi Chang, Yuan Wu
AI summary
More Choices, Fewer Decisions: Ordinal-Scale Bias in JEV-like Direct-Decision ModelsOverview
Research area: Reliability and bias analysis of direct-decision language models (JEV-style models that return a probability distribution over a user-supplied candidate list rather than generating free text).
Technical level: Intermediate — the paper uses information-theoretic metrics (effective support, entropy-based utilization ratios) that are clearly defined but assume familiarity with classification metrics such as TVD, nMAE, and QWK.
Scope: The paper diagnoses, disentangles, and mitigates a single phenomenon — "ordinal scale-utilization bias" — using one hosted model (JEV 1.13) and three open models (KEV-0.8B, KEV-4B, KEV-9B) across a 40-dataset panel plus controlled interventions and targeted post-training.
What This Paper Is About
Direct-decision models map text to a structured label chosen from a candidate list, but getting the right answer on individual items does not guarantee that the model actually uses the full scale it was given. The authors show that these models systematically concentrate their final decisions on a small part of an ordered (ordinal) candidate scale — a behavior they call ordinal scale-utilization bias — and then test whether that compression is an architectural limit or a learned, modifiable property. The goal is to establish a measurement for faithful scale use, rule out nearby explanations (low accuracy, gold imbalance, fixed position, candidate count), and demonstrate that targeted post-training can largely correct it.
Key Contributions
-
Diagnosing. The authors formulate ordinal scale-utilization bias as a population-level reliability problem, define an effective-support utilization ratio (comparing the entropy-based effective support of argmax decisions against that of gold labels), and document compression across 36 ordinal datasets and four models, contrasted against four nominal tasks.
-
Disentangling. They rule out competing explanations using candidate-order randomization (two permutations per item on six ordinal and three nominal datasets) and a same-item scale-refinement experiment with balanced gold support and balanced gold positions, showing that compression persists and intensifies as K grows.
-
Probability-space diagnostics. They show that the mean candidate probability vectors stay broad for most models even while final decisions compress — separating the decision-stage failure from probability concentration or ordinal error.
-
Mitigating. They show that BA-LoRA post-training on eight strongly compressed sources restores utilization on those scales at both KEV-0.8B and KEV-4B, with positive transfer to unseen ordinal sources at 4B but heterogeneous transfer at 0.8B.
Main Findings
-
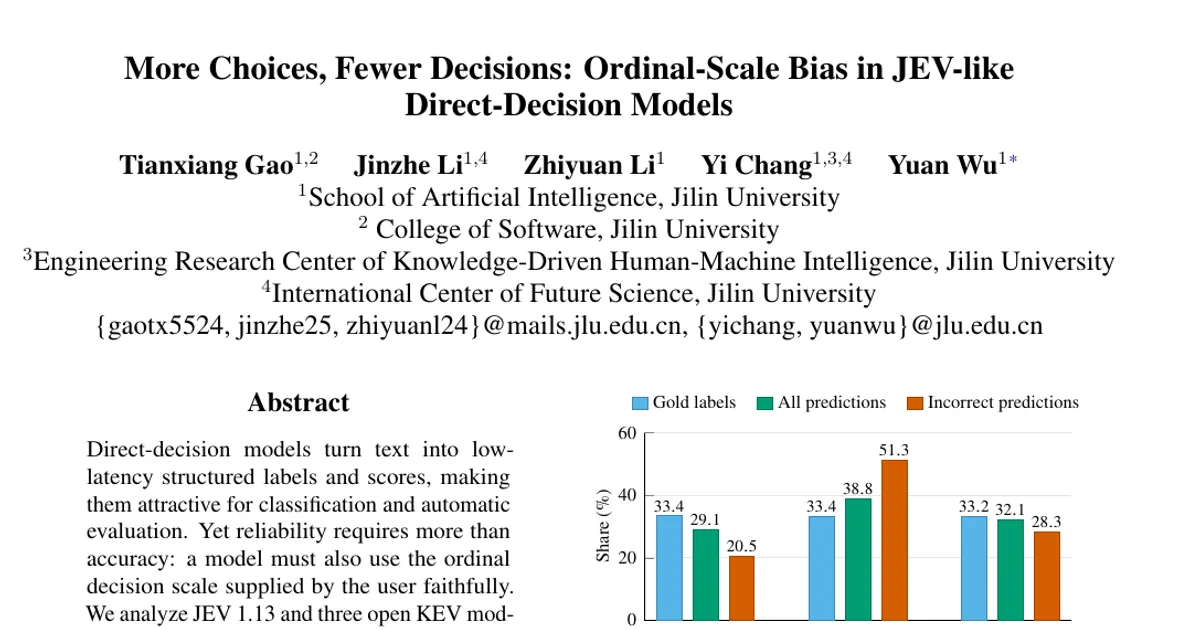
The ANLI observation. JEV 1.13 reaches 74.95% accuracy on all 6,400 ANLI development and test items (rounds R1–R3) but assigns 38.8% of all predictions and 51.3% of its 1,603 errors to Neutral, even though gold labels are nearly balanced (2,140 Entailment, 2,136 Neutral, 2,124 Contradiction). Neutral is selected for 37.2–39.6% of items at each candidate position. The authors explicitly note this is a clue, not proof of ordinal compression, because ANLI is nominal.
-
Compression is widespread on ordinal tasks but weak on nominal ones. Across the 36 ordinal datasets, decisions use only 67.2% (KEV-4B) to 75.8% (JEV 1.13) of effective gold support, while the four nominal tasks reach R = 86.6% to 101.9%. Ordinal TVD is 29.8–37.5%, against 6.0–18.6% for nominal. R falls below 70% on 14–18 datasets depending on the model.
-
Extreme single-dataset example. On the balanced 14-level RealToxicity Continuation task, JEV 1.13 assigns 66.2% of its predictions to Level 01, producing R = 25%.
-
Nominal exception. KEV-0.8B on SCOTUS is the one nominal case with heavy compression: the broad "Miscellaneous" class attracts 55% of predictions (R = 51%).
-
Candidate count correlates with compression, but differs by structure. Across ordinal datasets, R decreases with K for every model (Spearman ρ = −0.66 to −0.77), while nominal tasks with 7–14 classes stay far less compressed.
-
No universal direction. The modal predicted level falls in the lower third on 15–21 of 36 ordinal datasets, the middle third on 9–11, and the upper third on 6–12 — so the bias is not simply a preference for low, middle, or high scores.
-
Scaling helps accuracy more than utilization. Ordinal accuracy rises from 28.8% (KEV-0.8B) to 33.4% (KEV-4B) to 35.0% (KEV-9B), but R moves non-monotonically: 68.9% → 67.2% → 73.2%. KEV-4B is more accurate yet slightly more compressed than KEV-0.8B.
-
Randomizing candidate order weakens but does not remove the bias. Two random permutations produce the same ordinal label on only 58.1–59.9% of items for KEV models and 74.4% for JEV 1.13 (versus at least 95.6% on nominal items), with probability shifts of 9.4–10.1 TVD points on ordinal tasks versus 2.4–5.1 on nominal. Yet macro accuracy changes by at most 0.55 points for every model and subset. Randomization raises R from 65.0% to 70.4% (JEV 1.13), 61.1% to 73.7% (KEV-0.8B), 55.3% to 73.9% (KEV-4B), and 57.0% to 67.7% (KEV-9B), but randomized ordinal utilization remains only 67.7–73.9% while nominal stays at 98.6–99.3%.
-
Finer scales on the same items intensify compression. Holding items and source scores fixed on 1,400 items from three continuous-score sources with equal-frequency binning (gold effective support is 99.8% at K=2 and 97.0% at K=14), R falls from K=2 to K=14: 95.9% → 54.5% (JEV 1.13), 77.3% → 26.5% (KEV-0.8B), 97.9% → 68.4% (KEV-4B), 96.1% → 74.9% (KEV-9B). Endpoint losses range from 21.2 to 50.9 points.
-
Probabilities stay broad while decisions compress. For KEV-4B and KEV-9B, U_soft remains at least 96% at every K under both binning schemes, while the mean top-1 margin falls from 50–54 points at K=2 to 4–6 points at K=14. KEV-0.8B's margin falls from 33.8 to 13.7 points and its U_soft from 95.5% to 85.6%. JEV 1.13 shows compression in both spaces: margin 69.0 → 21.8 points, U_soft 96.8% → 80.5%. nMAE stays roughly stable, and endpoint equal-width QWK can even increase (0.437 to 0.504 for JEV 1.13).
-
DBpedia is a boundary condition. On 1,400 DBpedia items with random K-class subsets (up to 14 candidates), accuracy stays at least 98.9% at every K, R stays near 100%, and the top-1 margin remains above 96 points. The authors state this is a high-accuracy ceiling reference, not a difficulty-matched control, so it does not isolate semantic coupling as a causal mechanism.
-
Targeted post-training largely fixes the bias on supervised scales. Using BA-LoRA with 32,000 examples (4,000 each from eight strongly compressed sources), on the eight training-source datasets evaluated on disjoint held-out items, R rises from 47.4% to 86.8% (KEV-0.8B) and from 46.4% to 85.6% (KEV-4B). TVD falls from 54.7% to 19.7% and from 52.9% to 19.0%, and accuracy gains 13.0 and 15.3 points. Every targeted source improves in accuracy, R, and TVD.
-
Recovery reflects better decisions, not distribution spreading. On the eight training sources, U_arg rises by 38.7 points (KEV-0.8B) and 38.2 points (KEV-4B), while U_soft changes by only 0.9 and 6.3 points — most candidates were already represented in probability space; post-training mainly changes which candidates win.
-
Panel-wide gains on ordinal data. Across all 36 ordinal datasets, KEV-0.8B improves accuracy 28.8% → 32.3%, nMAE 30.5 → 24.0, QWK 0.370 → 0.488, and R 68.9% → 75.8%; KEV-4B improves accuracy 33.4% → 37.9%, nMAE 24.7 → 19.3, QWK 0.456 → 0.606, and R 67.2% → 82.3%. Nominal performance stays stable or improves for both.
-
Transfer depends on model size. For KEV-4B, the other 28 ordinal datasets improve from R = 73.2% to 81.3% and TVD from 33.1% to 27.6%. For KEV-0.8B, the same aggregate moves in the opposite direction: R = 75.0% to 72.7%, TVD 32.5% to 35.1%.
Methodology in Plain English
The authors treat the model's candidate list as a measurable resource and ask how much of it the final decisions actually occupy.
Measuring scale use. They take the empirical distribution of argmax decisions (p) and of gold labels (q) over K candidates. Using entropy-based "effective number of labels" (exp of entropy), they define a utilization ratio R = exp(H(p)) / exp(H(q)). R = 100% means the decisions have the same effective support as the gold labels; below 100% they call candidate-space compression. For table comparisons they use the absolute deviation D_R = 100|R − 1| in percentage points, where lower is better. They also report a nominal-space coverage measure U_arg = exp(H(p))/K, plus accuracy, total variation distance, soft utilization U_soft, normalized entropy, top-1 margin, nMAE, and QWK. All metrics are computed per dataset and macro-averaged.
The panel. Forty datasets, 5,000 items each, sampled without replacement and stratified by gold label using fixed seeds (20260926 or 20260927). Thirty-six are classified as ordinal (candidates form a shared graded scale with semantically adjacent levels); four are nominal (SNIPS K=7, Yahoo Answers K=10, SCOTUS K=13, DBpedia K=14). Gold distributions need not be uniform, so utilization is normalized against effective gold support. Outputs are mapped back to semantic labels by candidate text, so metrics are independent of presentation position.
Ruling out position. On six ordinal and three nominal datasets, they generate two candidate permutations per item that differ from each other and from the original order, then compare the original against the mean of the two randomized orders. They also measure item-level agreement and the TVD between the two probability vectors to quantify how sensitive an individual decision is to ordering.
Ruling out candidate count. They hold items and source scores fixed and vary K from 2 to 14 on 1,400 items from RealToxicity Continuation, Civil Comments Toxicity, and STS Benchmark Similarity. Equal-width bins preserve the natural scale; equal-frequency bins keep gold levels close to balanced. Candidate order is randomized and the gold position is balanced over all K positions in every condition. A DBpedia subset serves as a nominal ceiling reference using the same random K-class subset procedure.
Testing mitigation. They adapt KEV-0.8B and KEV-4B with BA-LoRA on a fixed 32,000-example set drawn from eight sources showing strong compression. Source IDs and normalized-text hashes of every post-training example are disjoint from the frozen 40-dataset evaluation panel, and results are reported separately for training sources, the other 28 ordinal datasets, all 36 ordinal datasets, and the four nominal datasets.
A note on the metrics. The authors stress that R = 100% means equal effective support sizes, not identical distributions, which is why TVD is reported separately.
Why This Matters
Impact on research. The paper reframes evaluation for direct-decision models: accuracy alone can hide systematic underuse of the available outcome space. It introduces a measurable quantity (R and its deviation D_R) that is distinct from accuracy, gold imbalance, position bias, and candidate count alone, and it demonstrates through post-training that the behavior is learned rather than architecturally fixed. This gives the evaluation community a diagnostic that can be applied to graders, rubric judges, and first-stage evaluators.
Real-world applications:
- **Rubric-based automatic
Authors’ abstract
Direct-decision models turn text into low-latency structured labels and scores, making them attractive for classification and automatic evaluation. Yet reliability requires more than accuracy: a model must also use the ordinal decision scale supplied by the user faithfully. We analyze JEV~1.13 and three open KEV models. Our investigation begins with ANLI, where JEV assigns 38.8\% of all predictions and 51.3\% of errors to Neutral despite 74.95\% accuracy, nearly balanced gold labels, and balanced candidate positions. Across 36 ordinal datasets, final decisions use only 67--76\% of the effective gold support, versus 87--102\% on four nominal tasks. Randomizing candidate order weakens but does not remove this compression. Holding items and source scores fixed while balancing gold support and positions, we refine scales from $K=2$ to $14$; utilization falls for every model and reaches 26--75\% at $K=14$, although candidate probabilities remain broad for most models. Targeted BA-LoRA post-training raises gold-relative utilization from roughly 47\% to 86\% on eight supervised scales at both KEV sizes, showing that the compression is learned and modifiable rather than an immutable architectural limit. We call this ordinal scale-utilization bias: decision-stage candidate-space compression distinct from accuracy, gold imbalance, fixed position, and candidate count alone. The code and data are available at https://github.com/Glax147/jev_ordinal_scale_bia