Research
Mining Citywide Dengue Spread Patterns in Singapore Through Hotspot Dynamics from Open Web Data
Overview Research area: Computational epidemiology / urban public health data mining, combining machine learning with open web-based disease surveillance data. Published at the ACM Web Conference 2026
- arXiv
- 2601.12856
- Published
- 2026-01-19
- Authors
- Liping Huang, Gaoxi Xiao, Stefan Ma, Hechang Chen, Shisong Tang, Flora Salim
AI summary
Overview
Research area: Computational epidemiology / urban public health data mining, combining machine learning with open web-based disease surveillance data. Published at the ACM Web Conference 2026 (WWW '26); arXiv:2601.12856v2 [cs.AI].
Technical level: Intermediate. The core idea is explained geometrically, but the model leans on gradient descent, matrix factorization, L1/L2 regularization, and SSIM-based matrix similarity comparisons.
Scope: The paper proposes a framework that learns latent, unobserved dengue transmission links between urban subzones from publicly archived dengue case reports alone, and shows the learned network both forecasts next-week hotspots and aligns with human commuting flows in Singapore.
What This Paper Is About
Dengue is a persistent mosquito-borne threat in tropical cities, and control efforts are far cheaper when they target areas likely to become hotspots next week rather than reacting to cases already reported. Most existing spatial dengue forecasting methods need rich, near-real-time inputs such as mobile phone mobility traces, building age, or fine-grained meteorology — data that many endemic cities simply do not have. The authors ask whether dengue's citywide spread pattern can be reverse-engineered from nothing more than weekly, geolocated case reports published openly by Singapore's National Environment Agency.
Key Contributions
-
A parsimonious spatiotemporal model of dengue hotspot dynamics. The authors formalize hotspot status as a directed acyclic graph in which a subzone's current hotspot state depends only on two channels: the previous H weeks of observed hotspot states across all subzones, and a hidden transmission-link matrix P. Ecological and entomological drivers are deliberately omitted because recent infections already summarize local conditions.
-
Learning latent inter-subzone transmission links by gradient descent. The matrix P^t, whose entries P_ij^t represent the invisible spread weight from subzone j to subzone i, is learned from hotspot observations alone, together with temporal weights w_h^t on past weeks. Learning minimizes a loss combining squared error with L2 and L1 regularization to keep P small and sparse.
-
External validation against an independent mobility network. The learned 2013 spreading network is compared to a commuting network built from 2,307,230 anonymized mobile users' home and work locations (2011 data, aggregated to subzones). The learned network, which never saw any mobility data, is shown to align with commuting flows.
-
A stability check on the inferred network. Using SSIM, originally an image-similarity measure, the authors test whether P^t and P^(t+1) agree across adjacent epidemiological weeks, providing a consistency test on the spreading pattern rather than a forecast score.
Main Findings
-
Forecasting performance across seven years. For Singapore 2013–2018 and 2020, mean Accuracy ranged from 0.9219 to 0.9988, mean Precision from 0.7744 to 0.9611, mean Recall from 0.6557 to 0.8833, and mean F-score from 0.7127 to 0.9010. The best year was 2017 (Accuracy 0.9988, Precision 0.9611, Recall 0.8833, F-1 0.9010); the weakest F-1 was 2013 at 0.7127 (Recall 0.6557, Precision 0.7956, Accuracy 0.9771).
-
Four weeks of history are enough. With H = 4 weeks of hotspot history, the model achieves an average F-score of 0.79, and the model requires only the current and previous four weeks of geolocated case data as input.
-
Robustness during the COVID-19 "circuit breaker." In 2020 — covering dengue locality data from 22 Feb to 3 July, spanning the circuit breaker from 7 April to 1 June — the model reached an F-score of 0.83 (Accuracy 0.9219 ± 0.0145, Precision 0.8626, Recall 0.8007), despite severe disruption to mobility patterns. This was the lowest-accuracy year but the second-highest F-score year reported.
-
The learned network is stable week to week. SSIM values between P^t and P^(t+1) were approximately 0.96 or larger across all years, indicating that the inferred spatial transmission matrix changes little between consecutive epidemiological weeks.
-
The learned network matches commuting flows. Comparing the 2013 learned network with the 2011 mobility network, ten planning areas (listed as 2, 9, 10, 12, 13, 17, 20, 27, 30, 37, 51) with high mobility flows to and from planning area 31 also showed high transmission risk to and from that area. Geographic distributions of high mobility density ratios and high transmission-in ratios were similar, particularly in the eastern areas of Singapore.
-
Recent weeks dominate. Temporal weights w_h^t vary by year, but w_1^t and w_2^t are generally larger than w_3^t and w_4^t, meaning hotspots in the most recent one to two weeks influence the current state most strongly, while three-to-four-week-old hotspots still contribute, more weakly but not negligibly.
-
Local and inter-regional transmission are distinct. High diagonal values of the learned matrix reflect substantial local transmission, which the authors attribute to short-distance mosquito travel rather than human movement; inter-regional (off-diagonal) links are what align with commuting.
Methodology in Plain English
Singapore is divided by its Urban Redevelopment Authority into 323 subzones, each averaging about 1.35 km² (excluding subzones with population density below 10 per km²), within a city-state of 781.9 km² and 5.7 million residents. The team downloaded publicly archived NEA dengue cluster snapshots from the SGCharts Outbreak platform — machine-readable CSV files for 2013–2018 and 2020, each recording street address, latitude, longitude, cluster number, recent cases, total cluster cases, and collection date.
A subzone counts as a hotspot in a given week if it contains at least c = 3 infection localities that week; a second, looser state variable marks a subzone if it has at least one locality, so that regions below the hotspot threshold still influence the model. The weekly hotspot state of every subzone is then assumed to be a weighted sum of the previous H = 4 weeks' hotspot states, passed through a learned N × N matrix P^t that encodes how much spread flows from each subzone to each other subzone.
Training works by gradient descent: the model starts P^t random, predicts current-week hotspots, compares them to what actually happened, and pushes P^t in the direction that reduces the error. A loss function adds an L2 penalty (keeping values small) and an L1 penalty (making the matrix sparse, on the premise that most subzone pairs never exchange dengue). Temporal weights w_h^t are tuned by enumeration from zero to one in increments such as 0.01. Hyperparameters H = 4, λ1 = 0.01 and λ2 = 0.1 were chosen by cross-validation. For forecasting, the learned weights are combined with recent observations, passed through a tanh activation, and thresholded so a subzone is flagged as a hotspot if its score exceeds the mean plus one standard deviation. The authors also aggregate weekly matrices into a yearly spreading network by normalizing each entry by that week's maximum value before summing.
To check whether the learned network is meaningful, the authors compare it to a commuting network derived from anonymized mobile phone records collected in 2011 — the home and work locations of 2,307,230 users, originally mapped to 320 m × 320 m grids and here re-mapped to subzones. Because that mobility dataset exists only for 2011, the comparison assumes the citywide commuting pattern in 2011 remained largely unchanged by 2013.
Why This Matters
Research impact. The paper reframes open web-based dengue surveillance from a reporting resource into a mining resource: the pathogen's invisible transmission routes become a learnable model parameter that can be inspected, validated, and compared against independent data. It shows that a sparse, interpretable matrix can stand in for mobility data that many cities do not possess, and it offers a stability-based form of validation (SSIM on consecutive weekly matrices) that differs from forecast-score validation.
Real-world applications.
- Targeting vector control: Singapore's NEA carried out roughly 107,000 home inspections in May and June of 2020 alone; a next-week hotspot forecast lets such resource-intensive inspections be concentrated where transmission risk is likely to emerge.
- Resource-limited endemic settings: the method needs only geolocated case data from the current and previous four weeks, which the authors argue is available or can be made available in many dengue-endemic cities and nations.
- Cross-checking mobility assumptions: the alignment between the learned network and commuting flows gives planners an interpretable explanation for how dengue can spread across a city despite the mosquito's short flight range.
- Outbreak contexts with disrupted mobility: the 2020 result indicates the approach still works when normal movement patterns are suspended.
Industry relevance. The work has direct relevance to public health agencies operating national surveillance platforms, urban planners and resilience teams, and insurers or civic tech groups that build on open municipal data. Dengue's estimated global health cost of about 9 billion dollars annually, and the estimated US$42.5 million annual burden in Singapore alone, frame the economic case for cheap, proactive targeting.
Future Directions
- Adapting the framework to other cities. The authors explicitly say the model may be applied elsewhere with adjustments to the spatial units and the hotspot-definition threshold, but do not demonstrate this on any city other than Singapore.
- Understanding the circuit-breaker anomaly. The paper states that revealing how circuit breaker measures impacted dengue spreading is pivotal, particularly for coupling commuting flows to cross-region spread, yet the 2020 analysis is presented mainly as a robustness check rather than a resolved explanation.
- Testing the mobility comparison on more years. The learned-versus-commuting comparison is carried out for 2013 only, because the mobility dataset is limited to 2011, and it relies on the assumption that commuting patterns stayed largely the same.
- Extending beyond purely case-based inputs. The paper deliberately excludes ecological and entomological variables to stay parsimonious and identifiable; whether selectively adding such variables could improve performance without confounding the learned transmission links remains open.
Target Audience
Public health researchers and epidemiologists working on vector-borne disease surveillance; machine learning and data mining researchers interested in interpretable spatiotemporal models and network inference from observational data; urban planners and government agencies responsible for vector control allocation in dengue-endemic regions; and web/data science practitioners working with open municipal health datasets. Readers need some comfort with matrix notation and gradient descent to follow the methodology, but the case study and interpretation sections are accessible without that background.
Authors’ abstract
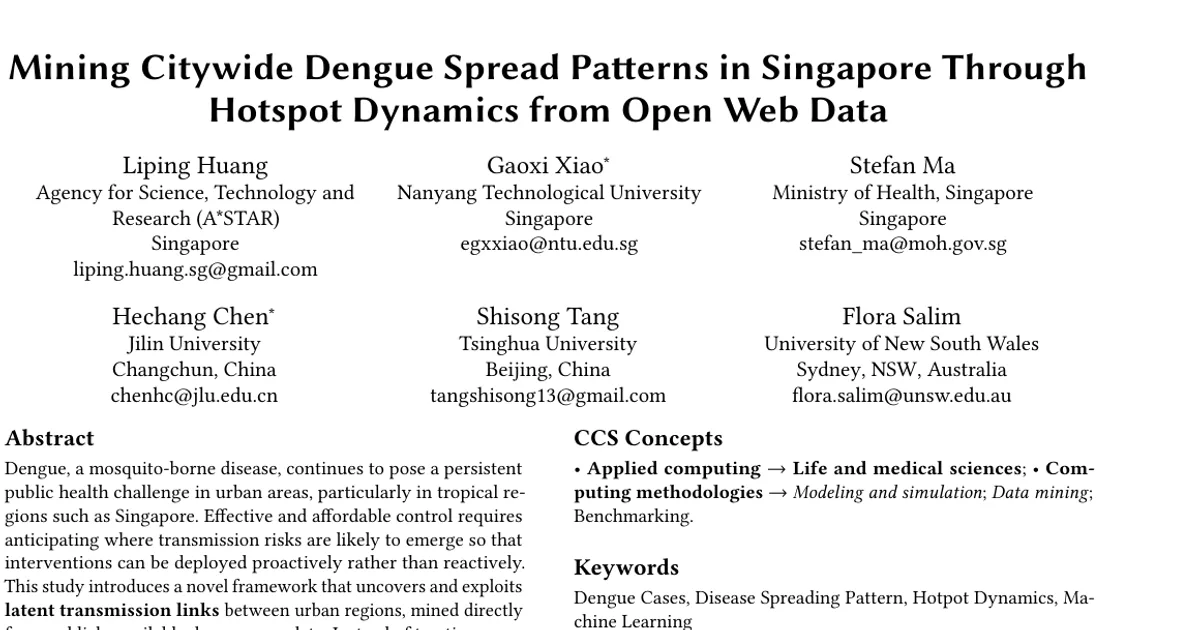
Dengue, a mosquito-borne disease, continues to pose a persistent public health challenge in urban areas, particularly in tropical regions such as Singapore. Effective and affordable control requires anticipating where transmission risks are likely to emerge so that interventions can be deployed proactively rather than reactively. This study introduces a novel framework that uncovers and exploits latent transmission links between urban regions, mined directly from publicly available dengue case data. Instead of treating cases as isolated reports, we model how hotspot formation in one area is influenced by epidemic dynamics in neighboring regions. While mosquito movement is highly localized, long-distance transmission is often driven by human mobility, and in our case study, the learned network aligns closely with commuting flows, providing an interpretable explanation for citywide spread. These hidden links are optimized through gradient descent and used not only to forecast hotspot status but also to verify the consistency of spreading patterns, by examining the stability of the inferred network across consecutive weeks. Case studies on Singapore during 2013-2018 and 2020 show that four weeks of hotspot history are sufficient to achieve an average F-score of 0.79. Importantly, the learned transmission links align with commuting flows, highlighting the interpretable interplay between hidden epidemic spread and human mobility. By shifting from simply reporting dengue cases to mining and validating hidden spreading dynamics, this work transforms open web-based case data into a predictive and explanatory resource. The proposed framework advances epidemic modeling while providing a scalable, low-cost tool for public health planning, early intervention, and urban resilience.