Research
Measuring Data Diversity with Embeddings: A Taxonomy and Benchmark for Diversity Measures
Overview Research area: Natural Language Processing — specifically data curation and the methodology of measuring corpus diversity with sentence/text embeddings. Technical level: Intermediate. Readers
- arXiv
- 2610.24888
- Published
- 2026-10-17
- Authors
- Cantao Su, Anna Wegmann, Esther Ploeger, Dong Nguyen
AI summary
Overview
Research area: Natural Language Processing — specifically data curation and the methodology of measuring corpus diversity with sentence/text embeddings.
Technical level: Intermediate. Readers should know what embeddings are and be comfortable with rank-correlation style evaluation, but the paper is primarily conceptual and empirical rather than mathematically heavy.
Scope (one sentence): The paper organizes 21 embedding-based diversity measures into a four-family taxonomy and introduces EmbDivBench, a benchmark that tests whether each measure actually tracks the variety, balance and disparity components of diversity on simulated vector data and on real Wikipedia text.
What This Paper Is About
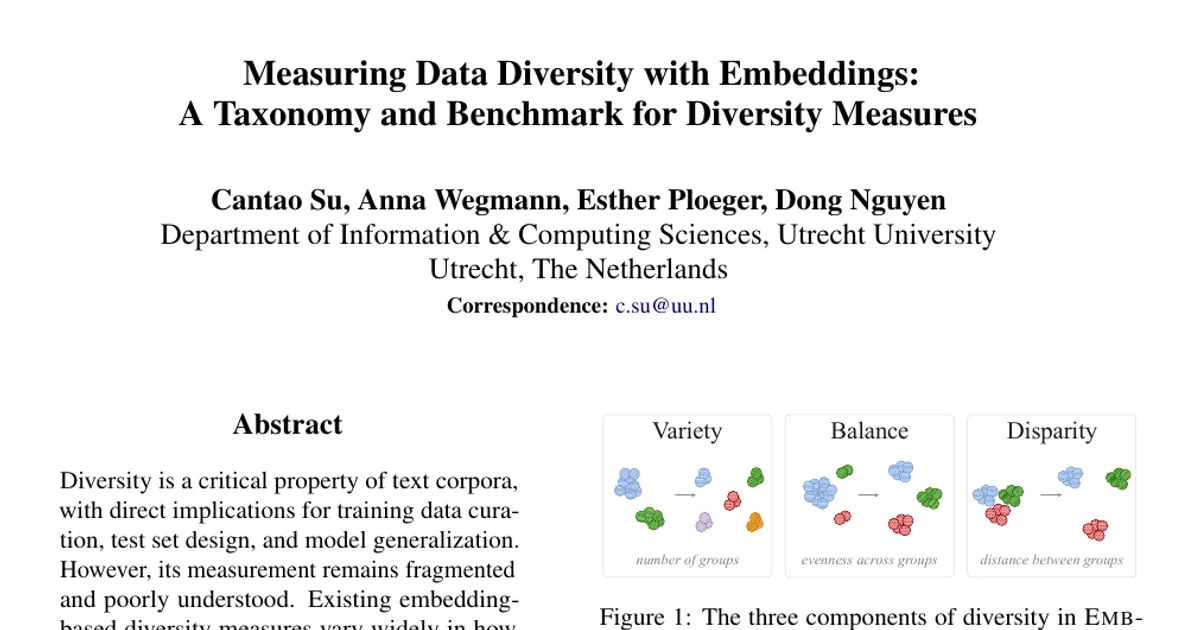
NLP researchers routinely call datasets "diverse," but the measures used to back that claim are scattered, inconsistently named, and rarely evaluated against each other. The authors first map the landscape of embedding-based diversity measures and then build a controlled benchmark to test whether these measures respond in the right direction when only one component of diversity — how many categories are present (variety), how evenly items are spread across them (balance), or how far apart the categories lie (disparity) — is changed. The goal is to tell practitioners which measures they should actually use.
Key Contributions
- A taxonomy of 21 embedding-based diversity measures grouped into four families according to the mathematical operation used to turn a set of embeddings into a single score: distance-based, geometry-based, distribution-based and graph-based.
- EmbDivBench, a benchmark with two complementary tiers — a simulated Gaussian-mixture tier with exact control over each diversity component, and a natural text tier built from Wikipedia topics and domains for the semantic dimension.
- A component-based empirical evaluation using Spearman's rank correlation between the ground-truth ordering of five dataset levels and each measure's scores, replicated over 5 random seeds per (tier, component) configuration.
- Practical selection recommendations, plus publicly released data and code (GitHub
nlpsoc/EmbDivBench) and an accompanyingemb-diversitypackage (Su et al., 2026) for applying and comparing measures.
Main Findings
- No measure is component-specific. Using the criterion of ρ ≥ 0.9 on one component and |ρ| ≤ 0.2 on the other two, no measure qualifies on either tier: measures that respond strongly to one component always respond to at least one other.
- Mean Pairwise Distance underperforms despite being the most common choice. It does well on the simulated tier but does not reach perfect correlation there (mean ρ < 1 on variety and balance), and on natural text its correlation drops to roughly half its simulated value. Vendi (q=1.0), Rényi Kernel Entropy and Graph Entropy consistently beat it across the three components.
- Real text is much harder than simulated data. Six distinct measures reach mean ρ ≥ 0.9 with across-seed standard deviation ≤ 0.1 on all three components in the simulated tier; no measure reaches that bar on natural text, and the weakening is broad rather than driven by a few failures. Log-Determinant, for example, drops from +1.00 to +0.24 on disparity.
- Disparity is the hardest component on both tiers, with the lowest mean and median scores. On simulated data variety scores higher than balance; on natural text variety scores lower than balance.
- Graph- and distribution-based families average stronger than geometry- and distance-based ones, and graph-based measures degrade least across tiers (0.10, versus 0.35 for distribution). Still, each family contains a strong member: on natural text the best member of each family lies within a gap of 0.11 (Chamfer Dist. +0.82, Cluster Inertia +0.85, Vendi +0.77, Graph Entropy +0.88), so the authors do not treat any family as inherently inferior.
- Graph Entropy is the best choice overall; Convex Hull Volume (CHV) the worst.
- Findings partly survive dimension and model changes. Rerunning the simulated tier at d ∈ {256, 384, 1024, 2048, 4096}, four of the six strong measures (Vendi q=1, Rényi Kernel Entropy, DCScore, Graph Entropy) stay above the bar at every dimension, while Mean Pairwise Distance falls below it at d = 256 and d = 1024 and Log-Determinant at d = 2048. The distance family overtakes geometry at every dimensionality other than d = 384, but their means differ by at most 0.13, so this ordering is not treated as stable.
- The embedding model must match the diversity dimension. With a Style Embedding, measures cannot capture semantic diversity; with Qwen3-Embedding-8B and e5-mistral-7b-instruct most findings hold, but individual measures diverge (Mean Pairwise Distance is weak on balance and variety with MiniLM, reasonable on both with Qwen3, and strong on balance but weak on variety with E5).
Methodology in Plain English
The authors start from Stirling's (2007) decomposition of diversity into variety, balance and disparity, and turn each into a staircase of five datasets where only that component changes while the other two are held fixed. Every dataset contains n = 10,000 elements, organized into k categories nested inside m super-categories: variety is varied by setting k ∈ {10, 20, 30, 40, 50} with m = 10; disparity is varied by setting m ∈ {10, 20, 30, 40, 50} with k = 50; balance is varied across five levels from uniform to strongly skewed with k = 50 and m = 10.
In the simulated tier, data are drawn from a hierarchical Gaussian mixture in 384 dimensions, with three nested scales (super-centre, category centre, element) so that the structure is exact by construction and no embedding model is involved. In the natural text tier, categories are Wikipedia topics and super-categories are broader domains, selected with farthest-point sampling over domain labels embedded with Qwen3-Embedding-8B; sentences are drawn from articles under each topic, capped at five sentences per article. One author manually checked 750 sentences (10 per dataset across 75 datasets) and found that about 17.9% do not support their Wikipedia topic; the authors argue this noise is spread evenly across levels, so it should not disturb the ordering.
The measures never see category labels — they only receive the raw embeddings (MiniLM-L6-v2, d = 384, for the text tier). Each measure is scored by the Spearman rank correlation between its values and the known ordering of the five levels, averaged over 5 seeds. A good measure is one whose score rises monotonically as the manipulated component rises.
Why This Matters
Diversity claims are used to justify dataset choices, but without knowing which measure tracks which aspect of diversity, those claims are hard to interpret. This paper makes the choice of measure an explicit, testable decision rather than a matter of convention, and shows that the field's default (Mean Pairwise Distance) is a weak default.
Real-world applications:
- Training data curation for language models: selecting or filtering corpora, where diversity is argued to improve task performance and compensate for smaller data sizes.
- Test set and benchmark design: checking that evaluation sets span many categories evenly and that those categories are genuinely distinct.
- Generated-text evaluation: judging the diversity of paraphrases, dialogue responses or synthetic data, where diversity is itself a user expectation.
- Fairness and representation audits: quantifying whether data over-represents certain varieties, domains or languages, and whether outputs are overly uniform or toxic-prone.
Industry relevance: teams that build data pipelines currently pick a diversity metric by habit or convenience; this benchmark gives evidence-backed shortlists (Chamfer Distance and MST Dispersion for variety, Graph Entropy for balance, MST Dispersion for disparity, Graph Entropy overall) plus an open package for applying them.
Future Directions
- Extend the benchmark to other diversity dimensions and real-data settings, such as stylistic or dialectal variation, since the natural text tier covers only semantic diversity via Wikipedia topics.
- Improve disparity measurement, which is the weakest component on both tiers and where several measures behave erratically or even anti-correlate.
- Investigate why real text is so much harder: whether the drop comes from label noise in the topic proxy, from properties of the embedding space, or both.
- Study embedding-model dependence more systematically, since individual measures changed behaviour between MiniLM, Qwen3 and E5, and the authors leave this to future work.
Target Audience
NLP researchers and graduate students working on data curation, dataset documentation, generation diversity or evaluation methodology; machine learning engineers who need a defensible diversity metric for a data pipeline; and anyone who has used Mean Pairwise Distance and wants to know what the alternatives are and how they compare.
Authors’ abstract
Diversity is a critical property of text corpora, with direct implications for training data curation, test set design, and model generalization. However, its measurement remains fragmented and poorly understood. Existing embedding-based diversity measures vary widely in how they are computed and can yield substantially different diversity scores on the same data, yet no systematic comparison of their empirical behaviour exists. We make two contributions toward addressing this gap. First, we present a taxonomy of 21 embedding-based diversity measures, organizing them into four families based on their underlying computations. Second, we introduce EmbDivBench, a benchmark that evaluates these measures along three conceptually distinct components (variety, balance and disparity) on both simulated and natural text data. Although Mean Pairwise Distance is the most commonly used measure, our experiments show that it is outperformed by several alternatives on the three diversity components, with Graph Entropy being the best choice overall. Lastly, we distil these findings into practical recommendations for diversity measure selection.