Research
Format Matters: The Robustness of Multimodal LLMs in Reviewing Evidence from Tables and Charts
Overview Research area: Natural language processing and multimodal machine learning, at the intersection of scientific claim verification (fact-checking) and chart/figure understanding. Technical leve
- arXiv
- 2511.10075
- Published
- 2025-11-13
- Authors
- Xanh Ho, Yun-Ang Wu, Sunisth Kumar, Florian Boudin, Atsuhiro Takasu, Akiko Aizawa
AI summary
Overview
Research area: Natural language processing and multimodal machine learning, at the intersection of scientific claim verification (fact-checking) and chart/figure understanding.
Technical level: Advanced. The paper assumes familiarity with multimodal LLMs, macro-F1 evaluation, zero-shot chain-of-thought prompting, and claim verification datasets.
Scope: The paper builds two adapted datasets that pair scientific claims with equivalent table and chart evidence, then evaluates 12 open-source multimodal LLMs and human annotators to test whether model performance holds up when the same information changes format.
What This Paper Is About
Scientific claims are usually backed by evidence in an experimental results section, and that evidence may appear either as a table or as a chart, depending on the author's preference. The authors ask whether multimodal LLMs can verify the same claim equally well when the identical information is shown in either format, since an AI-assisted review system that is format-sensitive would give biased evaluations. Because existing datasets rarely contain tables and charts expressing the same underlying data, the authors construct aligned datasets of their own and test models and humans on both formats.
Key Contributions
- The authors extend two existing datasets, SciTabAlign and ChartMimic, into SciTabAlign+ and ChartMimic+, which support scientific claim verification where table and chart evidence convey the same underlying information.
- They comprehensively evaluate 12 multimodal LLMs under three input settings (table-only, chart-only, and chart plus table combined), and further break down performance across four chart types: basic bar charts, symbol bar charts, line charts, and swapped charts.
- They show that current multimodal LLMs struggle with chart-based input while performing better on text-based table input, and that human annotators do not show the same difficulty, indicating a model limitation rather than task ambiguity.
- They analyze correlation between table-only and chart-only performance, finding that smaller multimodal LLMs (under 8B parameters) show weak cross-format correlation, meaning limited cross-modal generalization.
Main Findings
-
Tables beat charts almost universally: On SciTabAlign+, table-based input outperforms chart-based input for 11 of 12 models, with the sole exception being LLaVA-v1.6-Mistral-7B, where the two are nearly identical (57.6 vs. 57.7). The five largest gaps are 23.3, 21.7, 19.9, 18.7, and 18.6 for LLaVA-v1.6-34B, Qwen2.5-VL-7B, InternVL3-38B, InternVL3-14B, and Qwen2.5-VL-32B respectively, with the remaining gaps ranging from 9.3 to 17.8.
-
Combining chart and table always beats chart alone: On SciTabAlign+, the combined input outperforms chart-only input across all 12 models, with the largest gap being 26.3 (InternVL3-38B) and the smallest 0.5 (LLaVA-v1.6-Mistral-7B). Most other gaps exceed 10.0, except Llama-3.2-11B-Vision (7.3) and LLaVA-v1.6-34B (3.7).
-
Adding a table does not always help: For several models (Qwen2.5-VL-3B, Qwen2.5-VL-7B, Llama-3.2-11B-Vision, and LLaVA-v1.6-34B), table-only input beats the combined input on SciTabAlign+. InternVL3-1B, InternVL3-14B, and InternVL3-38B instead benefit from the combination.
-
Basic bar charts are easiest, symbol bar charts hardest: Six of twelve models achieved their best chart performance on basic bar charts, while line charts and swapped charts each had three models at their top score, and only InternVL3-1B did best on symbol bar charts (though at a low macro-F1 of 28.1). One model (Qwen2.5-VL-3B) tied across two chart types, bringing the count to 13 rather than 12. The 12-model averages across the four chart types are 53.0 (basic bar), 50.4 (symbol bar), 51.9 (line), and 51.3 (swapped).
-
The same pattern repeats on ChartMimic+: 11 models perform better with table input than chart input, with the four largest gaps being 28.1, 24.8, 17.2, and 14.6 for LLaVA-v1.6-34B, LLaVA-v1.6-Vicuna-13B, InternVL3-1B, and Qwen2.5-VL-3B. Qwen2.5-VL-7B is the only model that does better with chart input than table input.
-
Integration failures on ChartMimic+: For Qwen2.5-VL-3B, LLaVA-v1.6-Mistral-7B, LLaVA-v1.6-Vicuna-13B, LLaVA-v1.6-34B, InternVL3-1B, and InternVL3-8B, table-only input outperforms the chart-plus-table combination, with the four largest gaps of 18.6, 13.9, 10.2, and 10.1 for LLaVA-v1.6-34B, LLaVA-v1.6-Vicuna-13B, InternVL3-1B, and LLaVA-v1.6-Mistral-7B.
-
Humans are format-insensitive: Two annotators (both Master's students in Computer Science) labeled 50 randomly selected SciTabAlign+ samples, split into table-only and chart-only sub-tasks. They achieved macro-F1 of 94.0 for table-only evidence and 96.0 for chart-only evidence, with a Pearson correlation of 0.887 between the two annotators.
-
Correlation between formats grows with model size: On SciTabAlign+, correlation between table-only and chart-only performance is generally low, and InternVL3-1B shows negative correlation. On ChartMimic+, correlations are higher, with Qwen2.5-VL-32B, Qwen2.5-VL-72B, and InternVL3-38B exceeding 0.7. Across both datasets, models under 8B parameters in the Qwen and InternVL3 families do not show strong correlation between formats.
Methodology in Plain English
The authors began by adapting two existing datasets. From SciTabAlign, which contains 136 tables and 372 claims with text-based tables, they normalized the table data by removing HTML-like tags, bracket tags, and standardizing numeric values, which left 70 tables and 162 associated claims. From those 70 tables they generated four chart types: basic bar charts (colors distinguish bars), symbol bar charts (symbols such as "/" or "-" replace colors), line charts, and swapped charts (the x-axis labels are interchanged, turning "methods" into "metrics" and vice versa). The resulting SciTabAlign+ contains 372 claims with table evidence and 648 claims with chart evidence, 162 for each of the four chart types. Where a claim referred to "Table 4," the word was changed to "figure" for the chart-only setting so comparisons would be fair.
The second dataset came from ChartMimic's Direct Mimic subtask, which has 600 samples, each a PNG image plus Python code. The authors kept only 70 line charts and 80 bar charts, extracting the underlying table data automatically from the Python code. Four NLP researchers then verified and edited the tables to match the charts and wrote one supported and one refuted claim per table, encouraged to write complex rather than simple comparative claims. Sub-charts and charts generated with np.random.normal were excluded. The result was 152 claims based on 52 bar charts and 24 line charts, with a caption field added for information shown inside the chart.
They then evaluated 12 open-source multimodal LLMs from four families: InternVL3 (1B, 8B, 14B, 38B), Qwen-VL 2.5 (3B, 7B, 32B, 72B), LLaVA-v1.6 (mistral-7b, vicuna-13b, 34b), and Llama-3.2 (11B-Vision), all instruct-tuned. Each model was tested with table-only, chart-only, and combined inputs, using zero-shot chain-of-thought prompting and macro-F1 as the metric. Models ran on either one or two NVIDIA A100 80 GB GPUs with max_new_tokens=1024, and evaluation used scikit-learn's precision_recall_fscore_support.
Why This Matters
Impact on research: As AI agents make paper production more efficient, submission volumes rise and the need for automated peer-review assistance grows. If a review system is accurate on tables but unreliable on charts, its judgments could be systematically biased against papers that present results visually, even when the evidence is identical.
Real-world applications:
- Automated or semi-automated peer-review systems that check whether a paper's claims are actually supported by its reported results.
- Scientific fact-checking and claim-verification tools that let readers or editors test the validity of a specific claim against a paper's figures.
- Research-integrity screening pipelines that flag claims whose supporting tables or charts do not match.
- Document intelligence and accessibility tools that need to reason over charts and tables with equal reliability.
Industry relevance: Any organization extracting decisions or answers from documents mixing tables and plots, such as financial reports, clinical trial results, or engineering dashboards, faces the same format-sensitivity problem. The finding that chart understanding lags behind table reading identifies where model development investment is most needed, and the released code at https://github.com/Alab-NII/tables-vs-charts gives practitioners a benchmark for that.
Future Directions
- Improving multimodal LLMs' chart understanding specifically, since the paper concludes this is a crucial step toward robust scientific claim verification.
- Investigating multi-chart scenarios, which the authors explicitly excluded from annotation and left for future work.
- Extending beyond the chart types studied here (basic bar, symbol bar, line, and swapped) and beyond the bar and line charts retained from ChartMimic, which excluded forms such as 3D charts.
- Closing the cross-modal generalization gap in smaller models (under 8B parameters), which showed weak or even negative correlation between table and chart performance, and understanding why even larger models show strong correlation on ChartMimic+ but not on SciTabAlign+.
Target Audience
Researchers working on multimodal LLMs, chart and figure understanding, or scientific document processing; developers building automated peer-review or claim-verification systems; and NLP practitioners who need to know the practical reliability limits of current vision-language models when tabular data is rendered as a plot. The paper is also useful for benchmark designers, since it demonstrates the value of building datasets where the same content appears in aligned alternative formats.
Authors’ abstract
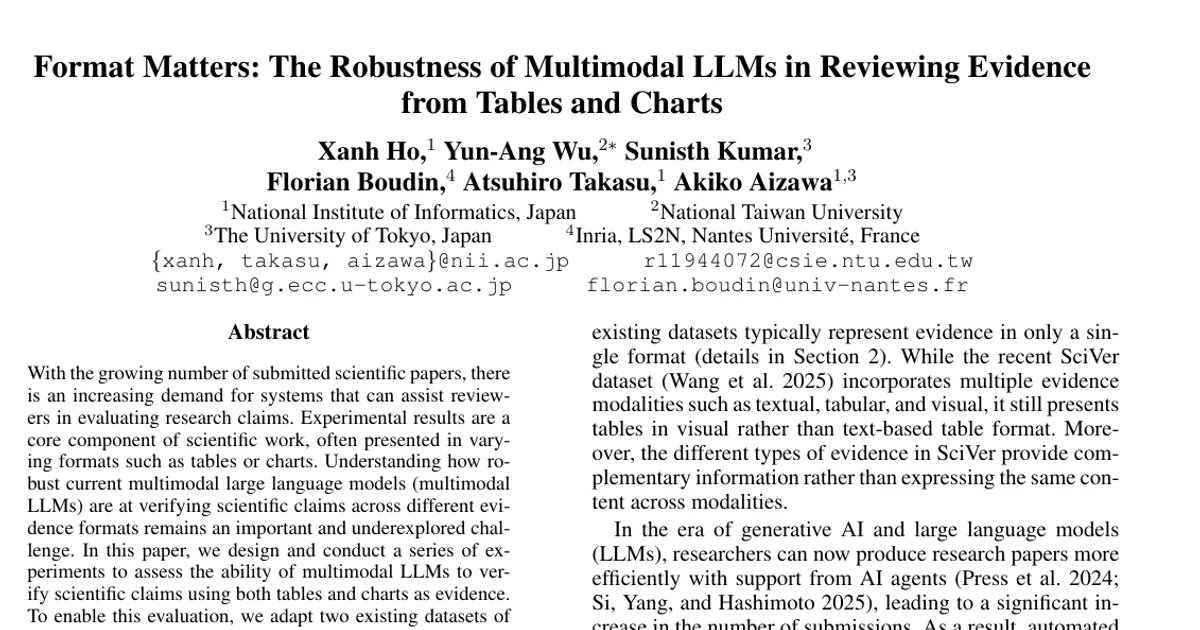
With the growing number of submitted scientific papers, there is an increasing demand for systems that can assist reviewers in evaluating research claims. Experimental results are a core component of scientific work, often presented in varying formats such as tables or charts. Understanding how robust current multimodal large language models (multimodal LLMs) are at verifying scientific claims across different evidence formats remains an important and underexplored challenge. In this paper, we design and conduct a series of experiments to assess the ability of multimodal LLMs to verify scientific claims using both tables and charts as evidence. To enable this evaluation, we adapt two existing datasets of scientific papers by incorporating annotations and structures necessary for a multimodal claim verification task. Using this adapted dataset, we evaluate 12 multimodal LLMs and find that current models perform better with table-based evidence while struggling with chart-based evidence. We further conduct human evaluations and observe that humans maintain strong performance across both formats, unlike the models. Our analysis also reveals that smaller multimodal LLMs (under 8B) show weak correlation in performance between table-based and chart-based tasks, indicating limited cross-modal generalization. These findings highlight a critical gap in current models' multimodal reasoning capabilities. We suggest that future multimodal LLMs should place greater emphasis on improving chart understanding to better support scientific claim verification.