Research
Explaining Digital Pathology Models via Clustering Activations
Overview Research area: Explainable AI for computational/digital pathology, specifically interpreting convolutional neural network (CNN) models applied to whole slide images (WSIs). Technical level: I
- arXiv
- 2511.14558
- Published
- 2025-11-18
- Authors
- Adam Bajger, Jan Obdržálek, Vojtěch Kůr, Rudolf Nenutil, Petr Holub, Vít Musil, Tomáš Brázdil
AI summary
Overview
Research area: Explainable AI for computational/digital pathology, specifically interpreting convolutional neural network (CNN) models applied to whole slide images (WSIs).
Technical level: Intermediate. The paper is conceptually accessible, but assumes familiarity with CNN convolutional feature maps, saliency-based explanations (GradCAM, HiResCAM, LRP, occlusion), and non-negative matrix factorization (NMF).
Scope: The paper introduces a clustering-based explainability technique that segments tissue on histopathology slides according to what a CNN "sees" in its internal activations, and evaluates it on an existing VGG-16 prostate cancer detection model.
What This Paper Is About
Saliency methods such as occlusion, GradCAM, HiResCAM, and LRP can only highlight which regions of a single slide drove a prediction, without explaining why those regions mattered. The authors propose instead to cluster the feature vectors produced by a convolutional layer so that regions of a slide that "look similar" to the model get grouped together, yielding a global, semantically segmented view of model behavior. They test this on a prostate cancer classifier built from a VGG-16 backbone and validate the resulting clusters against a pathologist's morphological descriptions.
Key Contributions
-
A clustering-based explainability technique for CNN-based digital pathology models that works on the internal feature vectors of a convolutional layer rather than on input-space relevance.
-
A pipeline that makes this tractable for WSIs, which have dimensions in the order of hundreds of thousands of pixels per slide and contain large amounts of empty space: overlapping tiles are de-duplicated by discarding a 2px-thick outline of feature vectors from each tile and averaging feature vectors across all tiles covering each location, and tiles whose inner 256 × 256 pixel area does not overlap tissue are discarded.
-
A qualitative and quantitative evaluation on an existing prostate cancer detection model from prior work, including expert pathologist interpretation of the clusters, correlation analysis between clusters, and a comparison against GradCAM, GradCAM++, and HiResCAM.
-
A demonstration that clusters refine rather than duplicate saliency-map information: because cluster membership is not restricted to a prediction target, clusters appear even where GradCAM assigns no positive weight, with low average overlap between them.
Main Findings
-
Clusters map onto recognisable morphology: A resident pathologist inspected the heatmaps of the NMF model with K = 6 and described the classes as: (1) fascicular structures with sparse elongated nuclei; (2) chains of densely packed nuclei, corresponding to carcinomatous areas in tumour-bearing slides and also capturing normal epithelium in non-tumorous slides; (3) similar to and overlapping with class 1, with emphasis on sparse tissue structure; (4) circular and/or semicircular small holes plus limited surroundings, highly sensitive to very small lumina (carcinoma); (5) similar to and overlapping with class 2; (6) tissue edges plus limited surroundings.
-
Effect of cluster count: The pathologist observed that higher values of K produced refined, coregistered clusters, while lower K merged more correlated clusters and decreased granularity. Three models were trained with K = 4, 6, and 8.
-
Correlated cluster structure: Analysis on a random sample of 10,000 tiles (8,369 negative, reflecting class imbalance) using mean class-weight correlation and cosine similarity of class vectors confirmed the mutual closeness of classes 1 and 3, and of classes 2, 4, and 5.
-
Clusters are predictive of cancer status: A logistic regression model predicting cancer positivity from the summed weights of each class achieved accuracy 0.984, precision 0.970, recall 0.937, F1 0.954, and AUC 0.998. Class coefficients were −0.013 (class 1), 0.240 (class 2), −0.068 (class 3), 0.462 (class 4), 0.368 (class 5), and −0.244 (class 6), indicating classes 2, 4, and 5 highlight pro-cancer features while 1, 3, and 6 appear more often in negative tiles. Using class coverage, maximal class weight, or average positive weight instead changed nothing about the signs of the model weights.
-
Comparison with CAM methods: Classes 2, 4, and 5 correlate strongly with GradCAM heatmaps, but overlap is low. IoU with the GradCAM mask was 0.00 ± 0.01 (class 1), 0.27 ± 0.12 (class 2), 0.01 ± 0.02 (class 3), 0.11 ± 0.10 (class 4), 0.15 ± 0.10 (class 5), and 0.01 ± 0.01 (class 6). Correlation with the GradCAM heatmap for class 2 was 0.65 ± 0.27 on benign tiles and 0.85 ± 0.11 on cancer tiles; for class 4, 0.39 ± 0.34 and 0.64 ± 0.14; for class 5, 0.50 ± 0.30 and 0.56 ± 0.12. Classes 1, 3, and 6 showed negative correlations. GradCAM++ and HiResCAM produced similar results.
Methodology in Plain English
The pipeline starts from a CNN that classifies a tissue patch as cancerous or not. The authors pick one convolutional layer — in their experiments the deepest one, which outputs a 32 × 32 grid with 512 channels — and treat the vector of 512 channel values at each spatial position as that position's "description" of what the model sees. They collect these vectors from many tiles into a matrix V and factorize it with NMF into two non-negative matrices W and H by minimizing the Frobenius norm of V − WH. The rows of H act as the K cluster "class vectors," and the entries of W say how strongly each cluster is present at each location. Because NMF needs non-negative inputs, the authors use layer outputs after ReLU; VGG-16 already applies ReLU so no modification was needed.
At inference on a new tile, H stays fixed and only W is re-optimized; each location is then assigned to the cluster with the highest weight. Two practical fixes make this work on whole slides. First, because patches overlap, one slide region appears in multiple tiles with multiple feature vectors; the authors drop the 2px-thick outline of feature vectors from each tile (where CNN behaviour is least reliable near tile borders) and average the remaining vectors for each location. Second, tiles whose inner 256 × 256 pixel area does not touch tissue are discarded, which is essential given the large background areas of WSIs.
For evaluation they used a published prostate cancer model: a binary classifier with a VGG-16 backbone, a global max-pool layer, and a single fully connected layer, trained to decide whether a patch's central 256 × 256 pixel area contains cancerous tissue, and reporting 100% slide-level accuracy on its test set. That model was built on hematoxylin- and eosin-stained patient prostate biopsies from the digital archive at the Department of Pathology, Masaryk Memorial Cancer Institute, Brno, with a positive/negative WSI ratio of 37/50 and manual polygon annotations of cancerous areas in all positive biopsies. Slides were tiled into overlapping 512 × 512 px patches with a stride of 256 px, processed at level 1 (10× magnification, resolution 0.344 µm/px), and labelled positive if the tile's central area overlapped the annotation. The clustering models were trained on 16 positive and 8 negative slides, giving 37,332 tissue tiles (10,927 positive, 26,405 negative), and inference was run on the entire test dataset of 87 WSIs.
Why This Matters
Research impact: The paper shifts explainability for pathology models from single-slide, single-prediction saliency toward a global description of what a model represents internally. It shows that a classifier never trained for segmentation can nonetheless produce a semantically meaningful segmentation, and it gives quantitative evidence that these clusters refine, rather than simply reproduce, the information in GradCAM-style maps. This complements prior work in the general-image and histopathology domains that used clustering or NMF for concept identification and weakly supervised tissue segmentation.
Real-world applications:
- Reviewing and auditing a deployed cancer-detection model before clinical use, by inspecting which tissue patterns each cluster captures.
- Communicating model reasoning to pathologists, whose descriptions of the K = 6 classes matched recognised morphological structures such as densely packed nuclei and small lumina.
- Triaging or quality-checking whole slides by mapping cluster overlays that appear even where GradCAM highlights nothing.
- Comparing candidate models for the same diagnostic task by contrasting their cluster structure.
Industry relevance: The stated barrier to clinical adoption is the reluctance of pathologists to trust opaque black-box models. Explainability that demonstrably aligns with the patterns pathologists already use is a practical route to faster adoption of CNN-based tools, and the method's design for whole-slide scale is a prerequisite for any commercial pathology product.
Future Directions
- Applying the technique to large foundational transformer models for digital pathology, plus other model architectures, since the method only requires that a model internally work with spatial feature vectors.
- Evaluating how well the methodology generalises to domains beyond digital pathology.
- Further investigation of the "why" behind each cluster's importance, addressing the paper's own observation that highlighting important regions does not by itself explain why they were assigned importance.
- Continued clinical evaluation by pathologists, building on the expert assessment of the K = 6 model and on the choice of cluster count, where the paper reports differing granularity between K = 4, 6, and 8 but no principled selection criterion.
Target Audience
Pathology and medical imaging researchers building or deploying deep learning models; explainable AI researchers interested in activation-space rather than input-space explanations; computational pathologists and clinical informatics teams evaluating whether a black-box model behaves in morphologically sensible ways; and machine learning engineers working with whole slide images, who will find the tile-overlap and background-discarding details directly reusable. Readers need some grounding in CNNs to follow the layer and channel discussion, but the core idea is stated without heavy mathematics.
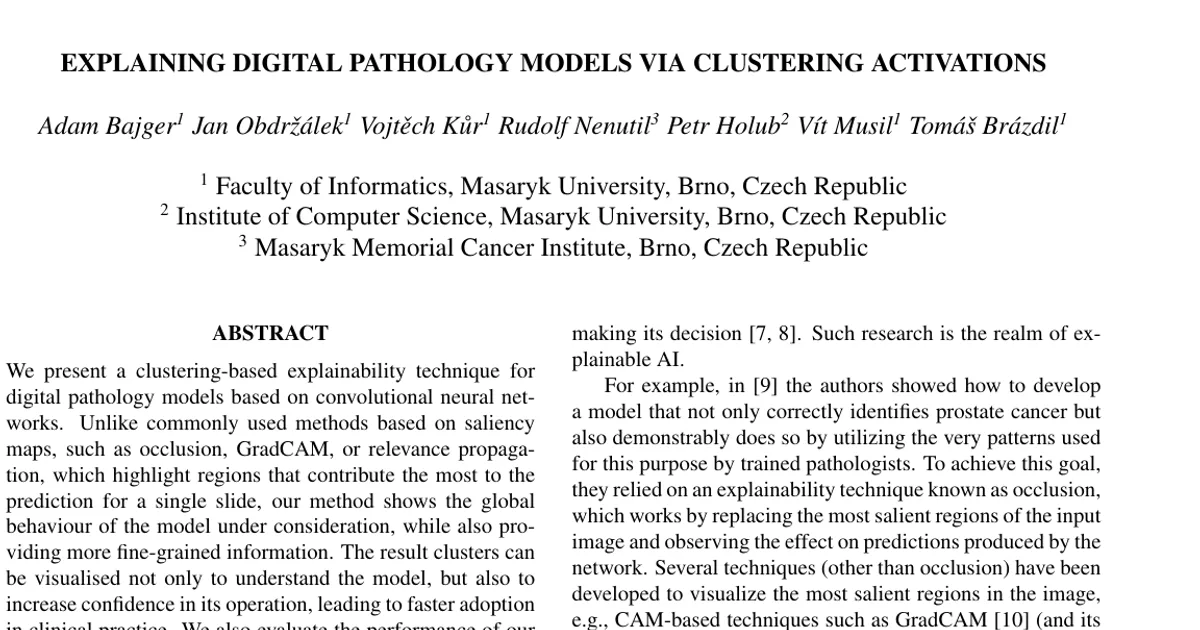
Authors’ abstract
We present a clustering-based explainability technique for digital pathology models based on convolutional neural networks. Unlike commonly used methods based on saliency maps, such as occlusion, GradCAM, or relevance propagation, which highlight regions that contribute the most to the prediction for a single slide, our method shows the global behaviour of the model under consideration, while also providing more fine-grained information. The result clusters can be visualised not only to understand the model, but also to increase confidence in its operation, leading to faster adoption in clinical practice. We also evaluate the performance of our technique on an existing model for detecting prostate cancer, demonstrating its usefulness.