Research
Diagnosing Conformal Prediction Failures Under Distribution Shift: A COVID-19 Case Study
Overview Research area: Uncertainty quantification for machine learning — specifically conformal prediction, distribution shift, and model-reliability diagnostics for tabular classifiers. Technical le
- arXiv
- 2601.00908
- Published
- 2026-01-01
- Authors
- Chorok Lee
AI summary
Overview
- Research area: Uncertainty quantification for machine learning — specifically conformal prediction, distribution shift, and model-reliability diagnostics for tabular classifiers.
- Technical level: Advanced. The paper assumes familiarity with conformal prediction (APS scoring), gradient boosting, SHAP feature attribution, and rank correlation statistics.
- Scope in one sentence: The paper proposes SHAP concentration — the fraction of feature importance held by the single top-ranked feature — as a pre-deployment diagnostic that predicts which gradient-boosted conformal classifiers will suffer large coverage losses under distribution shift, using COVID-19 supply-chain disruption as a naturalistic testbed.
What This Paper Is About
Conformal prediction promises coverage guarantees, but only under exchangeability. When real-world data drifts, those guarantees quietly break — and practitioners currently find out only after they have already deployed a model and observed its test performance. The paper asks a blunt question: can we tell before deployment which of several models on the same shifted data will fail catastrophically and which will hold up? Its answer is to look at the model's internal dependence structure, measured as the share of total SHAP importance concentrated in the top feature, and to show that this concentration is strongly associated with conformal failure severity — far more so than standard distribution-shift detectors.
Key Contributions
-
A pre-deployment diagnostic (SHAP concentration). Defined as the fraction of total mean-absolute SHAP importance concentrated in the top feature, computed only on validation data. It correlates with conformal coverage drop across 16 multiclass tasks in 9 domains at Spearman ρ = 0.853 (p < 0.001; Kendall τ = 0.667; bootstrap 95% CI [0.50, 0.96]) and within the 8 supply-chain tasks at ρ = 0.833 (p = 0.010). A 40% threshold transfers to 9 non-supply-chain datasets without tuning, with 7/9 deterministic outcomes; Covertype is correctly flagged at C = 49.8%. A model-sensitivity analysis (ρ = 0.833 LightGBM vs. ρ = 0.30 random forest, ρ = 0.43 MLP) locates the diagnostic's scope in gradient-boosted classifiers.
-
Formal theory plus comparative evidence. Theorem 1 shows that APS conformity-score and coverage bounds worsen monotonically with concentration C under stated assumptions, verified on all 5 applicable tasks. Catastrophic tasks show decreasing prediction entropy (confident misclassification). Meanwhile, standard shift indicators — MMD, C2ST, and PSI — detect shift uniformly across all 8 supply-chain tasks yet correlate at only ρ ≤ 0.19 with coverage drop.
-
An exploratory operational framework. A three-step protocol (compute C, check protective factors, monitor coverage) with an uncertainty band around the 40% threshold. Retraining partially recovers coverage (+19 pp, p = 0.036 unadjusted, single seed; Holm-corrected p = 0.11), and mitigation is shown to be mechanism-dependent.
Main Findings
-
Identical shift, wildly different failure. All 8 supply-chain tasks experience the same COVID-19 temporal split (train before February 2020, validation February–July 2020, test after July 2020), yet coverage drops range from 0.1% to 77.1%. Every drop is statistically significant (paired Wilcoxon p ≤ 0.005). s-payterms drops 77.1 pp while s-office drops 0.1 pp.
-
Concentration, not spread, is the signal. Top-1 concentration correlates at ρ = 0.833 (p = 0.010); Top-2 and Top-3 both fall to ρ = 0.524 (p = 0.183), Top-5 to ρ = 0.690 (p = 0.058), Top-10 to ρ = 0.399 (p = 0.328). Alternatives also fail to reach significance: HHI ρ = 0.619 (p = 0.102), Gini ρ = 0.500 (p = 0.207), entropy ρ = 0.571 (p = 0.139). The paper's explanation: sales-office has 77.0% Top-2 concentration but near-zero drop, so the signal is single-feature dominance, not overall inequality.
-
Shift detectors see the shift but not the danger. MMD (p < 0.002), C2ST (>99.9%), and PSI (>0.002) all flag shift on all 8 tasks, yet none correlates above ρ ≤ 0.19 with coverage drop.
-
Validation accuracy is not a proxy. In-distribution validation coverage clusters near the 90% target, spanning 83.6%–99.9%, while test coverage spans 12%–100%.
-
Mechanism differs between catastrophic and robust tasks. Catastrophic tasks show the dominant feature exploding in importance (4.5× increase) while holding top rank; robust tasks redistribute importance with a 10–20× spread across features and ranking reshuffle.
-
Cross-domain replication is the confirmatory endpoint. At n = 16 the partial Spearman controlling for log(num_classes) is ρ_partial = 0.771 (p = 0.0008) for concentration versus ρ_partial = −0.010 (p = 0.97) for class count. Within SALT alone (n = 8), neither partial correlation is significant (0.629, p = 0.131 for concentration; 0.334, p = 0.464 for cardinality).
-
Class count alone does not predict failure. Covertype (7 classes, C = 49.8%) fails catastrophically, while Avila (12 classes, C = 20.5%), PAMAP2 (12, 19.2%), and Pendigits (10, 14.5%) stay robust. KDDCup99 (11, 21.1%) is the principal intermediate-regime false negative, with a drop of 15.9 ± 21.4 pp.
-
Concentration measures vulnerability, not shift size. Concentration and shift magnitude are weakly related across SALT (ρ = 0.29, p = 0.49). Catastrophic tasks show strong rightward conformity-score shifts (KS = 0.68–0.96).
-
Mitigation is mechanism-dependent. ACI recovers marginal coverage (+47.5 pp on s-shipcond, +71.8 pp on s-group, +60.0 pp on s-payterms) but inflates sets; only s-shipcond stays deployable, with a usable-set rate of 30%. RAPS substantially helps high-cardinality tasks (s-group 73.5% → 10.4%; s-payterms 79.9% → 35.1%) but not the most concentrated one (s-shipcond 60.4% → 67.8%).
-
The diagnostic has a stated scope limit. It detects concentrated-dependence failures characteristic of gradient-boosted models but not global-sensitivity failures observed in neural networks (MLP ρ = 0.43, p = 0.29).
-
Power limits are acknowledged. At n = 8, power to detect ρ = 0.833 is approximately 0.76, below the 0.80 convention, so the within-SALT result is labeled exploratory. At n = 16, power exceeds 0.99.
Methodology in Plain English
The researchers used a supply chain benchmark (SALT, from RelBench) with temporal splits chosen to bracket the COVID-19 shock: training data comes from before February 2020, a validation period covers the onset (February–July 2020), and the test period runs after July 2020. All 8 classification tasks in that benchmark are included; none were excluded.
For each task they train a LightGBM classifier with fixed hyperparameters, split the validation set in half into a conformal calibration half and an evaluation half, and build an Adaptive Prediction Sets (APS) conformal predictor at α = 0.1, targeting 90% coverage. They repeat this across 50 independent seeds (42–91), where each seed is treated as an independent experimental trial rather than as an ensemble vote, giving paired comparisons via Wilcoxon tests and t-distribution confidence intervals.
The diagnostic itself is simple to compute: run TreeExplainer on validation data, take the mean absolute SHAP value of each feature, and divide the top feature's value by the sum over all features. This yields a number between 0 and 1, computed entirely before any test data is seen. Separately, they compare against simpler or post-hoc alternatives — native LightGBM gain concentration, ensemble disagreement, prediction entropy change, ECE shift, and Jaccard feature overlap between train and test feature values.
They then test whether the metric transfers: 9 external datasets are run through the identical pipeline with 10 seeds each, split into documented real-world shifts (Covertype geographic, Gas Sensor temporal, KDDCup99 attack-distribution, PAMAP2 subject-based) and null-shift controls (Shuttle, Avila, Pendigits, Satimage). A pre-COVID temporal placebo (train 2018, validate 2019-H1, test 2019-H2) checks that the diagnostic is specific to severe event-driven shift. Finally, they prove a theorem showing that in an idealized additive model, when a model concentrates dependence on a single feature that shifts out of distribution, APS conformity scores inflate and the coverage upper bound degrades monotonically with concentration.
Why This Matters
Impact on research. The paper reframes the conformal-prediction-under-shift problem from characterizing how coverage degrades to anticipating which models will degrade before test data exists. It shows that generic distributional shift detection is not a substitute for this, since MMD, C2ST, and PSI flag all tasks uniformly while correlating at ρ ≤ 0.19 with failure severity. It also repurposes SHAP from a post-hoc explanation tool into a prospective reliability signal, and grounds the empirical correlation in a formal monotonicity result.
Real-world applications:
- Supply chain and demand planning — the case study setting, where sales-document-driven tasks collapsed by 77.1 pp during COVID onset while entity-driven tasks held steady, and quarterly retraining helped some tasks but not others.
- Credit scoring — the PSI monitoring metric used here is described as standard in credit scoring practice, suggesting the diagnostic maps onto an existing regulatory monitoring workflow.
- Healthcare and epidemiology — any deployed classifier retrained on pre-event data and exposed to a pandemic-style regime change, where knowing whether the model is concentrated on one shifting feature is actionable before rollout.
- Tabular risk models in insurance, fraud, and logistics — where gradient-boosted classifiers dominate and temporal splits are the norm.
Industry relevance. The three-step protocol in Section 7 is designed for practitioners: compute the concentration figure, check protective factors (secondary features with train-validation Jaccard > 0.5 and importance > 15%), and flag as vulnerable if concentration exceeds 40% without those protections. It requires no test observations, no extra data collection, and only validation-time SHAP computation — making it cheap relative to a failed deployment. The paper is explicit that the 40% threshold is exploratory (derived from n = 8 SALT tasks) and needs prospective validation beyond boosting models.
Future Directions
-
Prospective validation of the 40% threshold. The authors repeatedly label the decision framework exploratory and note the threshold was derived from the SALT subset, with the protective-factor rule derived from a single observation (sales-office). A true pre-registered test on unseen deployment data is the obvious next step.
-
Extending beyond gradient boosting. The diagnostic is tied to the sequential additive structure of GBTs; random forests dilute single-feature concentration (ρ = 0.30) and MLP-SHAP approximations obscure it (ρ = 0.43, p = 0.29). Whether an analogous structural diagnostic exists for neural networks' global-sensitivity failure mode is unresolved.
-
Resolving the class-count confound with adequate power. Within SALT, log(num_classes) alone correlates with coverage drop at ρ = 0.743 (p = 0.035), and at n = 8 neither partial correlation is significant. The cross-domain partial correlation at n = 16 favors concentration, but a larger designed study would separate the two predictors causally.
-
Better mitigation for concentrated dependence. RAPS helps class-accumulation failures but not the most concentrated task, retraining is only partially effective and not significant after Holm correction, and ACI recovers coverage at a large cost in prediction-set informativeness. The open question is what intervention actually repairs a model whose predictions hinge on one unstable feature.
Target Audience
This paper is most useful to machine learning researchers and engineers working on uncertainty quantification, conformal prediction, or model monitoring for tabular data — particularly those deploying gradient-boosted classifiers on data with known temporal or event-driven drift. It also speaks to applied statisticians and risk-model validators in regulated domains (credit, insurance, supply chain) who need a concrete pre-deployment screening rule, and to methodologists interested in when interpretability signals can be used predictively rather than descriptively. Readers should already be comfortable with conformal prediction and SHAP; the paper does not build up that background.
Authors’ abstract
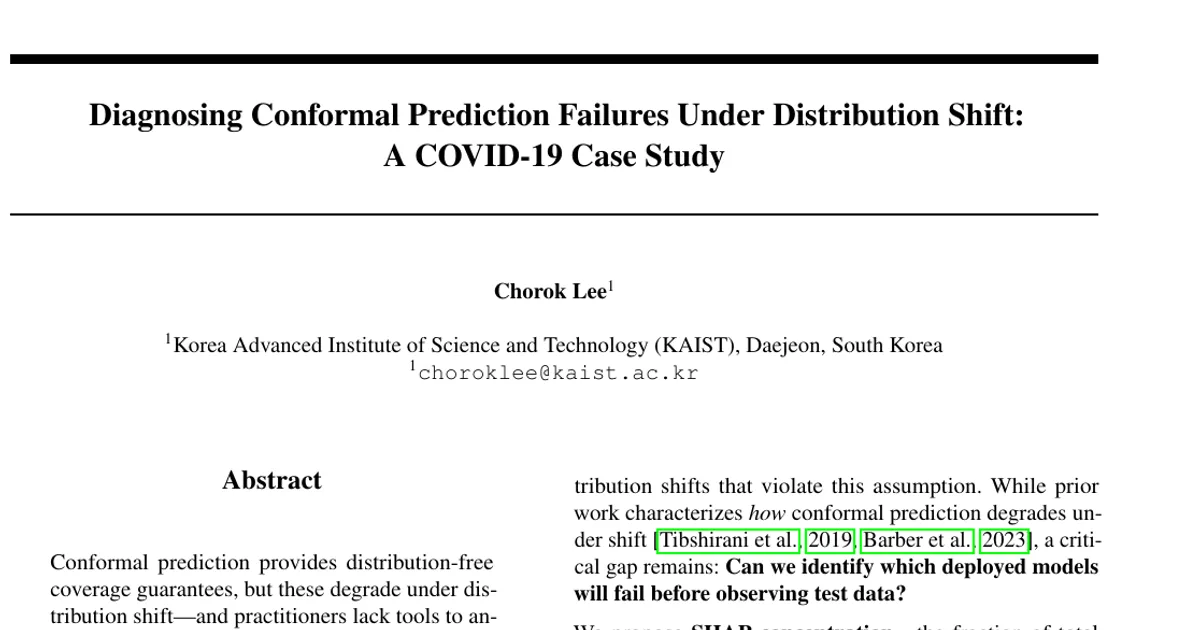
Conformal prediction provides distribution-free coverage guarantees, but these degrade under distribution shift - and practitioners lack tools to anticipate which deployed models will fail before observing test data. We propose SHapley Additive exPlanations (SHAP) concentration - the fraction of feature importance concentrated in the top feature - as a pre-deployment diagnostic for conformal prediction vulnerability in gradient-boosted classifiers. Using COVID-19 as a naturalistic case study, eight supply chain tasks experience identical temporal shift yet coverage drops ranging from negligible to catastrophic. Feature-importance concentration is strongly associated with failure severity across 16 multiclass tasks in 9 domains, while standard distributional shift detectors detect shift uniformly across tasks but cannot distinguish catastrophic from robust outcomes. External validation across 9 non-supply-chain datasets shows partial transfer. We prove a formal theorem showing that Adaptive Prediction Sets conformity-score bounds worsen monotonically with concentration under explicit assumptions, verified empirically. The diagnostic identifies concentrated-dependence failures characteristic of gradient-boosted models but does not detect global-sensitivity failures observed in neural networks. A decision framework operationalizes the diagnostic as an exploratory pre-deployment rule with an uncertainty band around a concentration threshold.