Research
DeXposure-FM: A Time-series, Graph Foundation Model for Credit Exposures and Stability on Decentralized Financial Networks
Overview Research area: Machine learning for finance — graph foundation models applied to systemic risk measurement in decentralized finance (DeFi). Technical level: Advanced. The paper combines forma
- arXiv
- 2602.03981
- Published
- 2026-02-03
- Authors
- Aijie Shu, Wenbin Wu, Gbenga Ibikunle, Fengxiang He
AI summary
Overview
Research area: Machine learning for finance — graph foundation models applied to systemic risk measurement in decentralized finance (DeFi).
Technical level: Advanced. The paper combines formal graph definitions, a pretrained transformer-based graph-tabular encoder, and multi-task fine-tuning, and assumes familiarity with link prediction, temporal graph neural networks, and network-based financial contagion models.
Scope: The paper builds and evaluates DeXposure-FM, a domain-specific time-series graph foundation model that forecasts inter-protocol credit exposures on DeFi networks and converts those forecasts into macroprudential stability measurements.
What This Paper Is About
In DeFi, one protocol often holds tokens issued by another, so credit exposure is implicit and token-mediated rather than written into bilateral contracts. A collapse in a widely held token can therefore cascade across protocols and blockchains, yet there is no standardized reporting of these exposures and few quantitative tools for monitoring them. The paper addresses this measurement gap by training a foundation model on large-scale reconstructed DeFi exposure data to forecast who owes whom, how much, and what a shock would cost the system.
Key Contributions
-
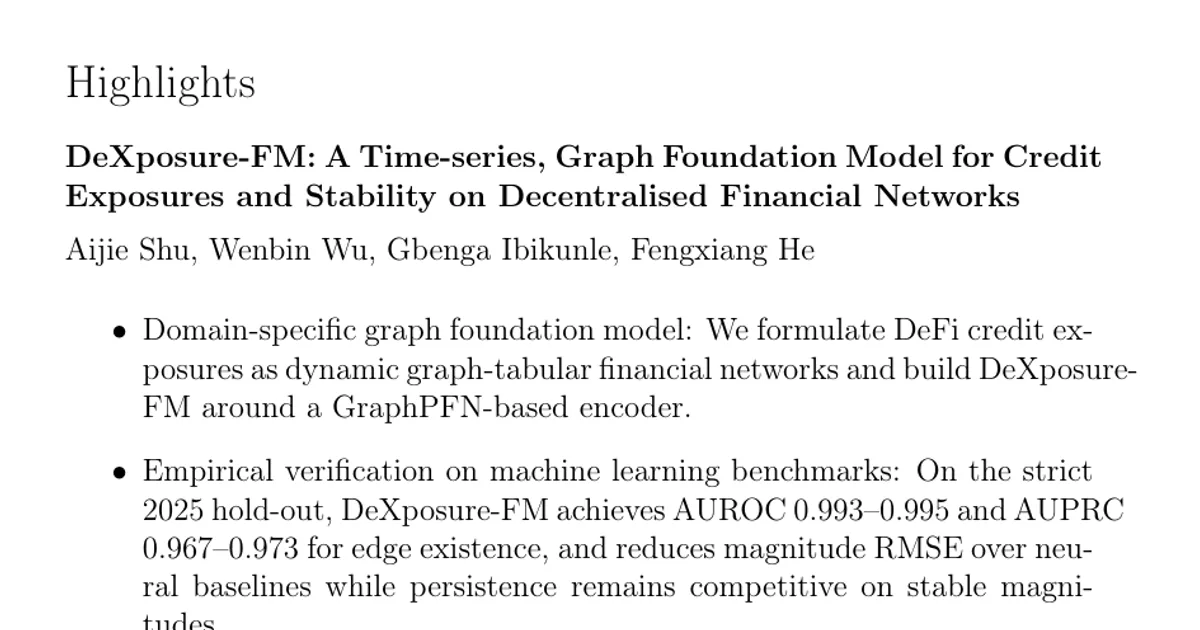
A domain-specific graph foundation model for DeFi exposures. The authors formulate inter-protocol credit exposures as dynamic graph-tabular financial networks and build DeXposure-FM around a GraphPFN-based encoder, trained on more than 43.7 million DeXposure observations covering 4,300+ protocols, 602 chains, and 24,300+ tokens.
-
Empirical verification on machine learning benchmarks. On the strict 2025 hold-out, DeXposure-FM achieves AUROC 0.993–0.995 and AUPRC 0.967–0.973 for edge existence, and reduces magnitude RMSE over neural baselines, while a persistence baseline remains competitive on stable magnitudes.
-
Financial economics measurement tools. Forecasted graphs feed deterministic measurements of protocol-level systemic importance, sector-to-sector spillover concentration, and DebtRank-style scenario losses; the authors report that empirical gains concentrate in worst-20% persistence-error regimes and bridge-sector shocks.
-
Open-source release and reproducibility. Model checkpoints are published at huggingface.co/EVIEHub/DeXposure-FM and code at github.com/EVIEHub/graph-dexposure.
Main Findings
-
Edge existence forecasting improves substantially. DeXposure-FM reaches AUROC 0.993–0.995 and AUPRC 0.967–0.973 across horizons of 1, 4, 8, and 12 weeks, compared with AUPRC 0.58–0.64 for the persistence baseline and 0.936–0.940 for a frozen GraphPFN encoder with a trainable probe.
-
Edge weight errors are lower than learned neural baselines. DeXposure-FM's edge-weight RMSE ranges from 3.388 (h=1) to 3.606 (h=12), versus 4.383 to 4.130 for frozen GraphPFN and 4.264 to 4.177 for ROLAND. Persistence records RMSE of 4.296 to 4.304, and its MAE is sometimes lower than DeXposure-FM's (for example 2.372 versus 2.489 at h=4), which the authors attribute to the strong week-to-week persistence of exposure magnitudes.
-
Node-level TVL change results are mixed. DeXposure-FM's MAE for log TVL change is close to persistence at short horizons (0.056 versus 0.057 at h=1; 0.140 versus 0.138 at h=4) and slightly higher at longer horizons (0.229 versus 0.213 at h=8; 0.286 versus 0.272 at h=12), while its RMSE is lower than persistence at all four horizons (0.400, 0.680, 0.890, 1.046 versus 0.403, 0.685, 0.899, 1.065).
-
The network is strongly persistent. Across 283 weekly snapshots from 2020-03-23 to 2025-08-18, the mean edge overlap ratio is 98.5%, with a mean of 5,676 nodes and 30,424 edges per week. This makes the carry-forward baseline hard to beat on average.
-
Gains concentrate in difficult regimes. The authors report that forecast gains are largest in structural-change and tail-error regimes, specifically worst-20% persistence-error regimes and bridge-sector shocks, where carry-forward assumptions are least reliable.
-
Contagion stress testing uses a fixed simulator. Stress-test losses are computed with a DebtRank-style contagion simulator under three scenarios: a 50% TVL loss to the largest protocol, a 30% TVL loss to the top-5 protocols, and a 100% TVL loss to bridge protocols. Comparisons are made on the common node set between origin and horizon weeks. The quantitative results of this stress-testing task are not reproduced in the provided excerpt, which is truncated within Section 5.3.1.
Methodology in Plain English
The authors treat each week of DeFi activity as a snapshot of a directed, weighted graph. Nodes are protocols; an edge from protocol p to protocol q means p holds tokens issued by q; the edge weight is the value of those token flows. Node attributes are tabular descriptors, including log-scaled total value locked (TVL), token counts, concentration measures, entropy, and a sector one-hot encoding.
To identify which protocol issues which token, they use a four-step fallback procedure: metadata lookup from DefiLlama, manual mapping for high-TVL tokens lacking metadata, TF-IDF text-vector similarity between token and protocol descriptions with a similarity threshold, and finally treating unmapped tokens as their own protocol (for example WETH).
The model has an encoder-plus-heads design. A pretrained GraphPFN graph-tabular encoder, initialized from open-source weights, produces node embeddings; the original GraphPFN head is discarded and the encoder is fine-tuned end-to-end alongside newly initialized heads. One head predicts edge existence plus a log-space residual for edge weight; another predicts log change in node TVL. Forecast horizons are 1, 4, 8, and 12 weeks.
Training uses an expanding-window walk-forward split to avoid look-ahead bias, uniform 5:1 negative sampling for the imbalanced edge-existence task, Adam optimization (β1 = 0.9, β2 = 0.999), learning rates of 5×10⁻⁴ for the heads and 5×10⁻⁵ for the backbone, up to 20 epochs with early stopping (patience 3) based on validation AUPRC, and gradient clipping at ‖∇‖₂ ≤ 1.0. The composite loss weights edge existence at 2.0, edge weight at 0.5, and node prediction at 20.0, calibrated against observed loss magnitudes of roughly 0.22, 2.4, and 0.05 respectively. Sharpness-Aware Minimization is described as a promising extension but is left to future work; all reported experiments use Adam.
Forecast quality is benchmarked against a frozen GraphPFN encoder with a trained MLP probe, ROLAND (a temporal graph neural network trained from scratch), and a persistence baseline that carries forward the last observed adjacency and weight matrices. Network-level statistics such as density, concentration, and sector connectivity are then computed as deterministic functionals of the predicted graph, keeping the forecasting and measurement layers separate.
Why This Matters
Impact on research. The paper demonstrates that the foundation-model paradigm — pretrain broadly, adapt with light heads — can be transferred to financial network measurement, where exposures are not reported on balance sheets and must be reconstructed from on-chain state. It also shows where such models do and do not beat simple persistence, which is an unusually honest framing for a forecasting paper and a useful benchmark for future DeFi risk work.
Real-world applications:
- Macroprudential monitoring of DeFi, including protocol-level systemic importance scores and sector-to-sector spillover measures.
- Scenario stress testing under counterfactual shocks, such as a large loss at the largest protocol or a complete loss at bridge protocols.
- Early-warning indicators built on shifts in network concentration and dependence on fragile collateral.
- Cross-chain contagion analysis, since the underlying data spans 602 blockchains and 24,300+ tokens.
Industry relevance. The paper is positioned for regulators, central banks, and risk teams that need quantitative tools for a market segment where policy authorities have flagged persistent measurement gaps. As links between crypto markets and the broader financial system deepen, methods that translate forecasted exposure graphs into concentration and spillover statistics offer a bridge between on-chain data and conventional financial stability reporting.
Future Directions
-
Enlarging the training data pool, which the authors list as the first of five planned directions for continuously updating DeXposure-FM.
-
Improving exposure measurement beyond raw TVL, addressing the current reliance on balance-sheet proxies reconstructed from token composition and valuation.
-
Managing model drift through periodic retraining, drift monitoring by sector and chain, and versioned releases tied to specific data vintages — a concern the authors explicitly raise given the nonstationarity of DeFi.
-
Architectural innovation and robustness training, including the unexecuted Sharpness-Aware Minimization extension, plus community-building through maintained public code and weights and running competitions.
Target Audience
This paper is most useful to quantitative researchers and graduate students working on graph machine learning or financial networks, to DeFi risk analysts and protocol researchers, and to regulators and central bank staff building monitoring capacity for decentralized markets. Readers without a background in either graph neural networks or credit-contagion modeling will find the empirical sections accessible, but the formal network definitions and model architecture require prior familiarity with the relevant literature.
Authors’ abstract
Credit exposure in Decentralized Finance (DeFi) is often implicit and token-mediated, creating a dense web of inter-protocol dependencies. Thus, a shock to one token may result in significant and uncontrolled contagion effects. As the DeFi ecosystem becomes increasingly linked with traditional financial infrastructure through instruments, such as stablecoins, the risk posed by this dynamic demands more powerful quantification tools. We introduce DeXposure-FM, the first time-series, graph foundation model for measuring and forecasting inter-protocol credit exposure on DeFi networks, to the best of our knowledge. Employing a graph-tabular encoder, with pre-trained weight initialization, and multiple task-specific heads, DeXposure-FM is trained on the DeXposure dataset that has 43.7 million data entries, across 4,300+ protocols on 602 blockchains, covering 24,300+ unique tokens. The training is operationalized for credit-exposure forecasting, predicting the joint dynamics of (1) protocol-level flows, and (2) the topology and weights of credit-exposure links. The DeXposure-FM is empirically validated on two machine learning benchmarks; it consistently outperforms the state-of-the-art approaches, including a graph foundation model and temporal graph neural networks. DeXposure-FM further produces financial economics tools that support macroprudential monitoring and scenario-based DeFi stress testing, by enabling protocol-level systemic-importance scores, sector-level spillover and concentration measures via a forecast-then-measure pipeline. Empirical verification fully supports our financial economics tools. The model and code have been publicly available. Model: https://huggingface.co/EVIEHub/DeXposure-FM. Code: https://github.com/EVIEHub/DeXposure-FM.