Research
Comparative Evaluation of Explainable Machine Learning Versus Linear Regression for Predicting County-Level Lung Cancer Mortality Rate in the United States
Overview Research area: Explainable machine learning applied to public health and health geography — specifically, predicting county-level lung cancer mortality in the United States and identifying th
- arXiv
- 2512.17934
- Published
- 2025-12-10
- Authors
- Soheil Hashtarkhani, Brianna M. White, Benyamin Hoseini, David L. Schwartz, Arash Shaban-Nejad
AI summary
Overview
Research area: Explainable machine learning applied to public health and health geography — specifically, predicting county-level lung cancer mortality in the United States and identifying the factors behind geographic disparities.
Technical level: Intermediate. The methods (random forest, gradient boosting, linear regression, SHAP, spatial hotspot analysis) are standard in applied machine learning and spatial epidemiology, and the paper is written for readers with some familiarity with predictive modeling terminology.
Scope (one sentence): The study compares random forest, gradient boosting regression, and linear regression for predicting county-level lung cancer mortality rates, then uses SHAP values and spatial hotspot analysis to interpret which variables matter and where mortality clusters.
What This Paper Is About
Lung cancer is a leading cause of cancer death in the United States, and predicting where mortality rates will be highest could help direct screening and intervention resources to the communities that need them most. Traditional regression models have typically been used for this kind of county-level prediction, but the authors ask whether explainable machine learning can predict better while also revealing which underlying factors drive the predictions. The goal is both accuracy and interpretability: a model that performs well and explains itself in terms of real, actionable variables.
Key Contributions
- Head-to-head model comparison. The study directly compares three approaches — random forest (RF), gradient boosting regression (GBR), and linear regression (LR) — on the same county-level lung cancer mortality prediction task, using R-squared and RMSE as evaluation metrics.
- Interpretability through SHAP. Rather than reporting predictive accuracy alone, the authors apply Shapley Additive Explanations to quantify each variable's importance and the direction in which it pushes predictions, turning a black-box model into a ranked, directional account of risk factors.
- Spatial disparity mapping. A Getis-Ord Gi* hotspot analysis is used to locate statistically significant geographic clusters of elevated lung cancer mortality, connecting the statistical model to actual places.
- Actionable framing. The findings are explicitly oriented toward intervention design, screening promotion, and addressing health disparities in the most affected regions.
Main Findings
-
Random forest performed best. The RF model outperformed both gradient boosting regression and linear regression, reaching an R-squared of 41.9% and an RMSE of 12.8. The abstract does not report the corresponding scores for GBR or LR, so the size of the gap between models is not available from it.
-
Smoking rate was the single most important predictor. SHAP analysis ranked smoking prevalence first in variable importance.
-
Housing value ranked second. Median home value was the next most important predictor, placing a socioeconomic/housing indicator above most other variables in the model.
-
Percentage of the Hispanic ethnic population ranked third. The share of the Hispanic ethnic population in a county was the third most important predictor identified by SHAP.
-
Mortality clusters were geographically concentrated. Spatial analysis revealed significant clusters of elevated lung cancer mortality in the mid-eastern counties of the United States.
-
Predictive power was moderate, not near-perfect. An R-squared of 41.9% means the model explains roughly two-fifths of the variation in county-level mortality rates — a meaningful but partial signal, which the abstract does not attempt to decompose further.
Methodology in Plain English
The researchers assembled county-level data across the United States and treated lung cancer mortality rate as the outcome to be predicted. They trained three models on this data side by side: a linear regression (the traditional baseline, which assumes a straight-line relationship between each predictor and the outcome), a random forest (an ensemble of many decision trees that can capture non-linear patterns and interactions), and gradient boosting regression (another tree-based ensemble that builds trees sequentially, each one correcting the errors of the previous ones). They judged each model on how much variation it explained (R-squared) and how far off its predictions were on average (RMSE).
To open up the tree-based models, they used SHAP values — a method from cooperative game theory that assigns each variable a contribution to each individual prediction. Aggregating these reveals which variables matter most overall and whether higher values of a variable push predicted mortality up or down. Finally, they applied a Getis-Ord Gi* hotspot analysis, a standard spatial-statistics technique that scans neighboring counties to find clusters where high mortality values group together more than chance would predict. The abstract notes that the intent was to surface both the drivers and the places.
Why This Matters
Impact on research. The paper sits at the intersection of two ongoing methodological debates: whether flexible machine learning models actually beat simpler regression for ecological health data, and whether interpretability tools like SHAP can make those models useful rather than merely accurate. Its findings suggest that the more complex model does add predictive value here, while SHAP lets the analysis retain a variable-level narrative that public health researchers can act on. It also demonstrates combining aspatial machine learning with formal spatial cluster detection in a single workflow.
Real-world applications:
- Targeted screening programs — directing low-dose CT screening outreach toward counties identified as mortality hotspots.
- Tobacco control policy — using the dominance of smoking rate as a predictor to justify concentrating cessation resources in high-prevalence counties.
- Socioeconomic and equity-focused interventions — the prominence of median home value and the percentage of the Hispanic ethnic population points to housing and demographic disparities as dimensions worth addressing alongside clinical factors.
- Resource allocation and health-department planning — hotspot maps give state and local agencies a concrete geographic target for intervention funding.
Industry relevance. Health insurers and population-health divisions, hospital systems doing community health needs assessments, and public health analytics vendors all perform county-level risk stratification. This paper offers a template for a pipeline — ensemble model plus SHAP plus spatial clustering — that such organizations could adapt to their own outcomes and regions, though the abstract does not address deployment, calibration, or prospective validation.
Future Directions
- Incorporate additional predictor domains. The abstract lists only the top three SHAP variables; variables capturing radon exposure, air quality, occupation, healthcare access, or screening uptake could improve on the 41.9% explained variance.
- Test temporal and geographic generalizability. Whether a model trained on one period predicts mortality in later years, or whether the identified mid-eastern hotspots persist or shift over time, is not established by the abstract.
- Move from association to causal inference. SHAP importance indicates predictive contribution, not causation; distinguishing the two would sharpen the policy recommendations.
- Validate against additional model families and evaluation designs. The abstract reports only RF, GBR, and LR, and only R-squared and RMSE — other explainable models, calibration measures, or spatially aware validation schemes remain open questions.
Target Audience
Public health researchers and epidemiologists studying cancer disparities; health geographers and spatial analysts; data scientists working in population health or healthcare analytics; and policy analysts who design or fund county-level cancer prevention and screening programs. Readers with a basic grounding in regression and machine learning will get the most from it, though the interpretation-focused framing is accessible to a broader public health audience.
Authors’ abstract
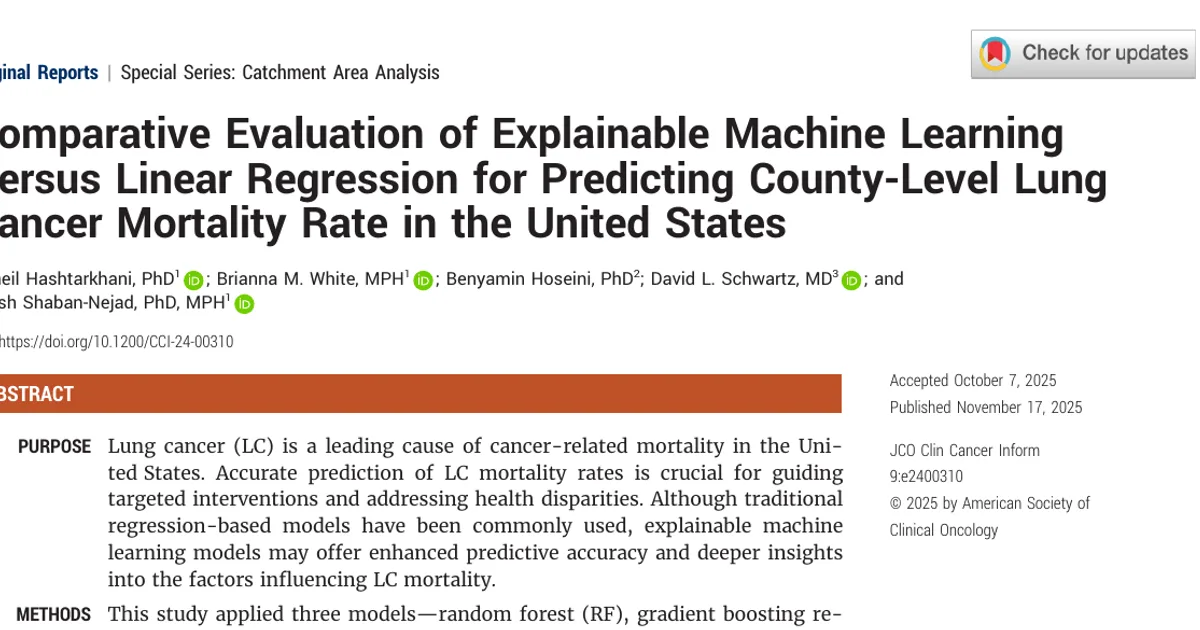
Lung cancer (LC) is a leading cause of cancer-related mortality in the United States. Accurate prediction of LC mortality rates is crucial for guiding targeted interventions and addressing health disparities. Although traditional regression-based models have been commonly used, explainable machine learning models may offer enhanced predictive accuracy and deeper insights into the factors influencing LC mortality. This study applied three models: random forest (RF), gradient boosting regression (GBR), and linear regression (LR) to predict county-level LC mortality rates across the United States. Model performance was evaluated using R-squared and root mean squared error (RMSE). Shapley Additive Explanations (SHAP) values were used to determine variable importance and their directional impact. Geographic disparities in LC mortality were analyzed through Getis-Ord (Gi*) hotspot analysis. The RF model outperformed both GBR and LR, achieving an R2 value of 41.9% and an RMSE of 12.8. SHAP analysis identified smoking rate as the most important predictor, followed by median home value and the percentage of the Hispanic ethnic population. Spatial analysis revealed significant clusters of elevated LC mortality in the mid-eastern counties of the United States. The RF model demonstrated superior predictive performance for LC mortality rates, emphasizing the critical roles of smoking prevalence, housing values, and the percentage of Hispanic ethnic population. These findings offer valuable actionable insights for designing targeted interventions, promoting screening, and addressing health disparities in regions most affected by LC in the United States.