Research
Clusters in Focus: A Simple and Robust Detail-On-Demand Dashboard for Patient Data
Overview Research area: Human-Computer Interaction / Visual Analytics, with an applied focus on health informatics (the paper is categorized under cs.HC, with CCS tags for "Human-centered computing –
- arXiv
- 2601.11524
- Published
- 2025-11-11
- Authors
- Lukas Schilcher, Peter Waldert, Benedikt Kantz, Tobias Schreck
AI summary
Overview
Research area: Human-Computer Interaction / Visual Analytics, with an applied focus on health informatics (the paper is categorized under cs.HC, with CCS tags for "Human-centered computing – Visual analytics" and "Applied computing – Health informatics").
Technical level: Advanced. The paper is a short conference-style system paper describing an interactive dashboard, its client-server architecture, and a single-domain use case. It is readable by non-specialists, but assumes familiarity with clustering, the Jaccard Index, and visual analytics design conventions.
Scope in one sentence: The paper presents Clusters in Focus, a web-based dashboard that lets a user pick a cluster in one 2D feature-pair projection and then systematically find other feature pairs that produce a similar cohort, as demonstrated on a Parkinson's disease speech dataset.
Authors and venue: L. Schilcher, P. Waldert, B. Kantz, and T. Schreck, all of the Institute of Visual Computing, Graz University of Technology. The first two authors contributed equally; Peter Waldert is the corresponding author. It is posted as arXiv:2601.11524v1 [cs.HC], dated 11 Nov 2025, under a CC BY 4.0 license. The work was supported by the HEREDITARY Project under European Union Horizon Europe grant agreement No GA 101137074, and part of it was outlined in a technical report, Deliverable 5.1.
What This Paper Is About
When a dataset has many features, the same patients can be grouped differently depending on which features you look at. Researchers often work with two features at a time, because pairs stay interpretable in a scatterplot, but checking every possible pair by hand quickly becomes infeasible. Clusters in Focus addresses the specific task of taking one cluster the user already finds meaningful and automatically discovering which other feature pairs split the data into a similar group of patients.
Key Contributions
-
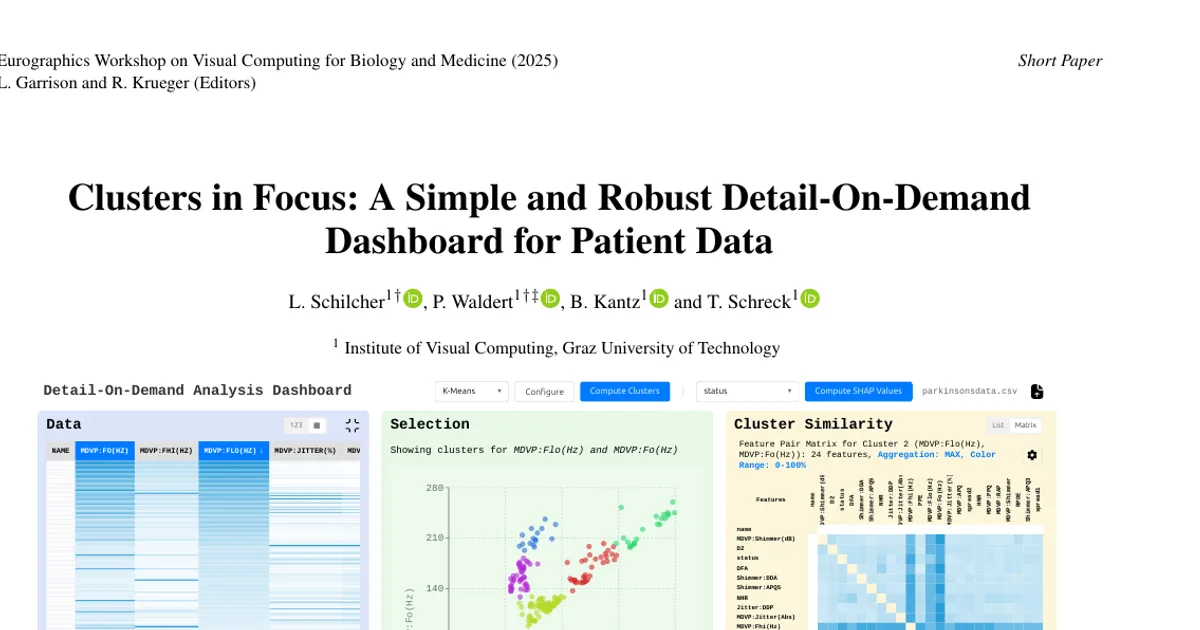
A coordinated three-panel dashboard. The Data Panel offers tabular, heatmap, and condensed (mini-histogram) views with optional SHAP-based feature importance ranking; the Selection Panel shows a 2D scatterplot clustered with K-Means or DBSCAN on two user-selected features; and the Cluster Similarity Panel activates once a point (and therefore its cluster) is clicked.
-
A novel Cluster Similarity Panel with two switchable views. A List View ranks all (feature pair, cluster ID) combinations by Jaccard similarity to the user-selected source cluster, while a Matrix View aggregates those scores into a feature-by-feature heatmap with interactive reordering (e.g., Optimal Leaf Ordering) to expose global structural patterns and blocks of related features.
-
A defined analytical workflow for cross-pair cluster comparison. Clustering is re-run with the same algorithm and parameters for every other unique feature pair, and each resulting cluster is compared against the source cluster using the Jaccard Index J ∈ [0, 1], measuring overlap in data point membership.
-
An open, dockerized implementation plus a biomedical use case. The full source is available at github.com/hereditary-eu/ClustersInFocus and can be built and started with
docker compose buildanddocker compose up; a Parkinson's disease speech use case illustrates the workflow.
Main Findings
-
Cross-pair cohort discovery works in the demonstrated case: Starting from the pair MDVP:Flo(Hz) (minimum fundamental frequency) and MDVP:Fo(Hz) (average fundamental frequency) with K-Means at k = 5, the analyst selected "Cluster 2" and found that other feature pairs, especially those involving vocal perturbation, identify highly similar cohorts.
-
The Matrix View with Optimal Leaf Ordering revealed a distinct high-similarity block: The reordering grouped the fundamental frequency measures with features related to non-linear dynamics (DFA, PPE, spread1) and vocal stability (HNR), indicating that "Cluster 2" is not an artifact of a single feature pair but a stable cohort identifiable across a family of acoustic measurements. The paper also notes strong relationships with jitter (Jitter:DDP) exposed as bright horizontal and vertical lines.
-
Clinical relevance is suggested by overlap with a label: The substantial overlap between "Cluster 2" and the cohort defined by the clinical
statuslabel (healthy/PD) supports the clinical relevance of the discovered subgroup. -
Design positioning against prior tools: The paper argues that interactive clustering tools (Clustrophile 2, Cluster Sculptor, Clustervision) optimize or validate clustering within a single fixed feature space, that VICTOR compares partitions from the same feature set rather than different feature combinations, that Caleydo and LineUp do not target systematic cluster-composition comparison across feature-pair subspaces, and that subspace tools like Patterntrails and SmartStripes rank subspaces by abstract metrics or trace individual points rather than centering on a user-selected cluster.
-
Stated limitations are acknowledged rather than benchmarked: The approach is limited by combinatorial growth in feature pairs for very high-dimensional data and by its focus on 2D projections. Practical tests indicate unresponsiveness with datasets exceeding several megabytes, attributed to the backend's in-memory processing and the frontend's direct rendering of all data points.
-
No quantitative evaluation or user study is reported. The paper describes the use case as providing "indication" of usefulness and states that future work should refine the requirement analysis and evaluate the approach in different domain settings.
Methodology in Plain English
The researchers built a web application around a strict three-step workflow. First, the user uploads a CSV dataset and explores it in the Data Panel using a spreadsheet-like table, a color-coded heatmap of normalized feature correlations, or a condensed list of miniature per-feature histograms; optionally, a SHAP-based ranking of feature importance can be computed by selecting a target variable.
Second, the user selects precisely two features by clicking their column headers (selecting a third automatically deselects the chronologically first one). The Selection Panel then draws a 2D scatterplot of those two features, with points colored by cluster assignment. The user picks the clustering algorithm (K-Means or DBSCAN) and its hyperparameters (k for K-Means; eps and min_samples for DBSCAN) from header controls and triggers the computation on a Python backend.
Third, the user clicks a point in the scatterplot to select its cluster. The system then retrieves or computes, using the same algorithm and parameters, the clustering for every other unique feature pair in the dataset, and computes the Jaccard similarity between the source cluster and each individual cluster from each of those pairs. Those scores feed two presentations: a ranked table of (feature pair, cluster ID) combinations for targeted lookups, and a feature-by-feature heatmap where each cell holds an aggregated score (e.g., Maximum or Average) for that pair, which can be reordered to reveal block structure. The frontend is React with TypeScript running in the browser and handles only visualization and interaction; a lightweight FastAPI Python backend handles computation and result caching.
Why This Matters
Impact on research: The work targets a concrete gap between two existing practices — clustering within a fixed feature space and ranking whole subspaces by abstract quality metrics — by instead asking which different feature pairs reproduce the same cohort. This makes findings from a single interpretable 2D view verifiable across many other views, which matters for validating hypotheses about subgroups rather than only generating them.
Real-world applications (as grounded in the paper's motivation and use case):
- Biomarker discovery: Researchers looking for objective measures that indicate a biological state can check whether a candidate pair's cohort is reproduced by other, related measures.
- Disease subtype characterization: Understanding how different features describe a disease's subtypes, rather than assuming one global clustering is correct.
- Alternative or complementary marker identification: Once established biomarker pairs are known, finding related pairs that characterize a similar cohort can lead to novel hypotheses or reveal previously overlooked correlations.
- Voice and clinical measurement analysis: The demonstrated use case uses the Parkinson's Disease speech dataset from the UCI Machine Learning Repository, which contains voice measurements and a
statusattribute (healthy/PD), to identify speech patterns that differentiate the groups.
Industry relevance: The tool is open source and dockerized, and was produced within an EU Horizon Europe project (HEREDITARY), suggesting relevance to translational health research groups and anyone doing cohort stratification on tabular clinical or sensor data. Its client-server split keeps interactive performance in the browser while outsourcing heavier computation, which is a practical deployment pattern for institutional environments.
Future Directions
- Handling higher-dimensional feature combinations, likely guided by dimensionality reduction techniques or feature importance measures, since combinatorial growth in feature pairs limits the current pairwise approach.
- Adding more similarity metrics, such as the Adjusted Rand Index, and exploring asymmetric or subset-aware measures to better capture relationships between clusters of differing sizes.
- Addressing scalability, since the backend's in-memory data processing and the frontend's direct rendering of all data points can lead to unresponsiveness with datasets exceeding several megabytes — a problem the authors say can be easily addressed in future versions.
- Improving usability and validation, including more explicit user guidance beyond the implicit workflow that follows Shneiderman's "Overview first, zoom and filter, details-on-demand" mantra, a pre-loaded default dataset to lower the entry barrier, a refined requirement analysis, and application and evaluation of the approach in different domain settings.
Target Audience
This paper is most useful to visual analytics and HCI researchers working on interactive clustering and subspace comparison, and to biomedical or clinical data scientists who routinely explore tabular patient datasets feature-pair by feature-pair. Tool builders looking for an open-source, dockerized reference implementation of coordinated views with a Python backend will also find it directly actionable. Readers seeking a rigorous quantitative evaluation or a user study will not find one here; the paper presents a system design, a positional argument against prior tools, and a single illustrative use case.
Authors’ abstract
Exploring tabular datasets to understand how different feature pairs partition data into meaningful cohorts is crucial in domains such as biomarker discovery, yet comparing clusters across multiple feature pair projections is challenging. We introduce Clusters in Focus, an interactive visual analytics dashboard designed to address this gap. Clusters in Focus employs a three-panel coordinated view: a Data Panel offers multiple perspectives (tabular, heatmap, condensed with histograms / SHAP values) for initial data exploration; a Selection Panel displays the 2D clustering (K-Means/DBSCAN) for a user-selected feature pair; and a novel Cluster Similarity Panel featuring two switchable views for comparing clusters. A ranked list enables the identification of top-matching feature pairs, while an interactive similarity matrix with reordering capabilities allows for the discovery of global structural patterns and groups of related features. This dual-view design supports both focused querying and broad visual exploration. A use case on a Parkinson's disease speech dataset demonstrates the tool's effectiveness in revealing relationships between different feature pairs characterizing the same patient subgroup.