Research
BIRD: A Museum Open Dataset Combining Behavior Patterns and Identity Types to Better Model Visitors' Experience
Overview Research area: Human-Computer Interaction / User Modeling, specifically cultural heritage data collection, visitor behavior modeling, and recommender systems for museums. Technical level: Int
- arXiv
- 2602.11160
- Published
- 2025-12-29
- Authors
- Alexanne Worm, Florian Marchal, Sylvain Castagnos
AI summary
Overview
Research area: Human-Computer Interaction / User Modeling, specifically cultural heritage data collection, visitor behavior modeling, and recommender systems for museums.
Technical level: Intermediate. The paper is a dataset description paper; the data collection protocol and file formats are explained plainly, but the clustering validation relies on standard unsupervised learning metrics (Silhouette score, WCSS, Davies-Bouldin Index, Calinski-Harabasz Index) that assume some familiarity with machine learning.
Scope: The paper presents BIRD (Behavioral and Identity-Related Dataset), an open dataset of 51 museum visitors combining spatiotemporal trajectories, gaze-derived artwork viewing lists, questionnaire-based identity data, and explicit feedback, collected at the Nancy Museum of Fine Arts.
What This Paper Is About
Open datasets in cultural heritage are scarce, and the ones that exist tend to be ad hoc, capturing only the few visitor characteristics needed to evaluate one specific model rather than a holistic picture of the visitor. The authors ran a study in which 51 visitors explored a museum freely while wearing eye-tracking glasses, then combined that behavioral data with demographic, psychological, and preference data from questionnaires to build a public dataset. The goal is to make it possible to model and re-enact visitor identities — and ultimately to personalize recommended museum paths in terms of number of points of interest, time spent at each, and amount of information provided.
Key Contributions
-
An open, multi-modal museum visitor dataset (BIRD): 51 visitor identities combining contextual data (demographics, preferences, visiting habits, motivations, social context), behavioral data (spatiotemporal trajectories and gaze data), and feedback (satisfaction, fatigue, liked artworks, verbatim comments). The dataset URL is https://mbanv2.loria.fr/.
-
Trajectories with direction and speed, not just positions: Unlike prior datasets that record only participant positions at timestamps, the authors used a custom web platform to reconstruct trajectories where direction and speed of movement are known in real time. Raw and normalized trajectories are both provided.
-
A demonstrated link to established visitor typologies: The authors performed K-means clustering on trajectory features and recovered four clusters that they identify as the Veron and Levasseur profiles (Grasshopper, Ant, Fish, Butterfly), offering a proof of concept that the dataset supports identity analysis.
-
Supplementary museum-side resources: The release includes floor plans (PDF and JSON), artwork descriptions (period, theme, description), and daily statistics, alongside the visitor data.
Main Findings
-
Dataset scale: 51 visitor identities are currently available. The study involved 51 visitors and more than 400 artworks from the 16th to 21st centuries. The authors plan to progressively increase the number of participants.
-
Demographics: 27 males, 23 females and 1 non-binary person. Mean age is 33 years, ranging from 12 to 75 years old.
-
Visit timing: Average visit duration is 57.6 minutes, with a minimum of 11 minutes and a maximum of 1 hour and 55 minutes. (The abstract describes the free exploration as averaging 57 minutes.)
-
Viewing volume and pace: On average, 144 items are seen per visitor, at a speed of around 0.26 m/s. The authors describe this speed as low for the environment, which causes many stops — approximately 54 stops per visit.
-
Trajectory length: Average trajectory length is 838 meters, with a minimum of 254 meters and a maximum of 1361 meters.
-
Artwork engagement: Each visitor spends an average of 29 seconds in front of selected artworks.
-
Clustering result: K-means on trajectory information (length, number of items seen, number of stops, speed, duration) produced 4 clusters as the most appropriate number, according to the elbow method with WCSS loss, Silhouette score, Davies-Bouldin Index and Calinski-Harabasz Index. The cluster centroids correspond to Grasshopper, Ant, Fish and Butterfly profiles.
-
Only paintings were annotated: Only paintings were included in the list of visible artworks; if a visitor stopped at another kind of item (e.g., a sculpture), it was not taken into account in the analysis.
-
Gaze data collection method: Tobii Glasses 2 (100Hz) were used, with eye-tracking cameras and a scene camera; the authors manually pointed the visitor's position on a JSON map via a web platform to reconstruct trajectories.
-
Not reported: The paper does not report gaze-level metrics such as fixation counts or dwell distributions beyond the artwork viewing lists and the 29-second average time before selected artworks, nor does it report statistical significance tests for the clustering.
Methodology in Plain English
The work took place between February and March 2019 at the Nancy Museum of Fine Arts, which welcomes around 300,000 visitors every year. Visitors were approached at the beginning of their visit, informed about the study and data collected, and asked to sign a consent form. They then toured the museum's 3 floors freely, without a guide or recommender system.
Each of the 51 participants wore eye-tracking glasses that recorded what they looked at and where they walked. Because raw eye-tracking video does not directly yield a map position, the team built a web platform where a researcher manually pointed at the visitor's position on a JSON floor plan as the visit played back. A second window handled artworks: all walls containing paintings were clickable, and the researcher clicked the wall and selected the right image when a visitor noticed a painting. The resulting lists were split into two groups — one marking the start of viewing an artwork and one marking the end — which allowed the team to derive viewing durations. JSON outputs were converted to CSV files for ease of use across languages.
Before and after the visit, participants filled in questionnaires (23 questions pre-visit, 29 post-visit, each available in French and English). All 51 visitors chose to complete both. The pre-questionnaire covered demographics (age, qualifications, gender), visit preferences and frequency, motivation and objectives (objectives were defined using Falk's identities), and physiological/psychological data such as fatigue, distance tolerance and crowd tolerance. The post-questionnaire covered art expertise, the perceived benefits of new technologies such as applications and recommender systems, physical and psychological states at the end of the visit, information about artworks memorized, and other comments.
Afterwards, visitors used a platform to select artworks they liked from a mosaic of all museum artwork photographs, randomly distributed by floor, regardless of whether they had actually seen them. This elicits artistic preferences and also measures the coverage rate of the visit relative to preferences — that is, items likely to interest the visitor that were missed during exploration.
Raw trajectories were noisy because they were produced manually and were sometimes too precise, preventing detection of global patterns. The team normalized them with the MovingPandas library v0.20.0, using an interval of two seconds between two different positions. Coordinates are in pixels, where 100 pixels correspond to 1 meter. From each trajectory they extracted duration, average speed, number of stops, trajectory length and number of items observed.
Finally, to test whether the dataset supports identity analysis, they applied K-means clustering to the whole-trajectory features and used several indices to choose the number of clusters.
Why This Matters
Impact on research: The authors state that, as far as they know, no dataset exploiting the different characteristics of visitors for recommendation and identity analysis in an indoor environment has been produced and made public. BIRD was built independently of any single research hypothesis or model, so it is intended to be generic — the authors compare its intended role to what MovieLens served in another application domain. It is released under a CC-BY-NC-SA 4.0 license, with a citation of the paper required for research use.
Real-world applications:
- Personalized museum routes: Tailoring the number of points of interest, the time spent at each, and the amount of information given to each visitor based on their level of interest.
- Recommender system comparison: The data supports Content-Based Filtering, Collaborative Filtering and Trajectory recommendation, allowing different approaches to be compared on the same data.
- Crowd and trajectory simulation: Combined with the project's second objective — a reproduction of the museum in Unity — the data feeds simulation of crowds and paths.
- Virtual guides and NLP: The dataset is proposed for virtual guide development and for Natural Language Processing over visitor comments.
Industry relevance: Museums deciding between imposing a narrative (signage, audio tours) and leaving visitors free to explore can use personalized recommendations as a middle path. The dataset also gives cultural institutions a concrete template for instrumenting visits with eye-tracking and questionnaire data, and gives developers of museum apps and indoor navigation a realistic behavioral testbed.
Future Directions
- Generalization testing: The authors note the data were collected in a specific context over a limited period. One future work is verifying whether the dataset can be generalized to other situations; another is checking whether adding order-of-visit information (chronological or not) affects the classification.
- Growing the dataset: Progressively adding more visitors and giving access to gaze data.
- More behavioral and identity-related features: Enriching the dataset with isovists and artwork complexity, so as to train a sequence-based recommender system and test its ability to predict visiting styles over time, tailoring recommendations according to visible items and the cognitive load artworks bring.
- Data augmentation for deep learning: Applying a data augmentation technique to enlarge the dataset while trying to maintain the coherence of each visitor, in particular their behaviors and trajectories.
Target Audience
Researchers and practitioners in user modeling, recommender systems, and human-computer interaction working on cultural heritage or indoor environments; museum professionals and exhibition designers interested in evidence-based personalization; and machine learning practitioners who need a multi-modal dataset that combines trajectories, gaze-derived artwork views, questionnaire-based identity data, and explicit feedback in one place. Readers looking for a benchmark leaderboard or trained model results will not find them here — the paper is a dataset and protocol description with a clustering proof of concept.
Authors’ abstract
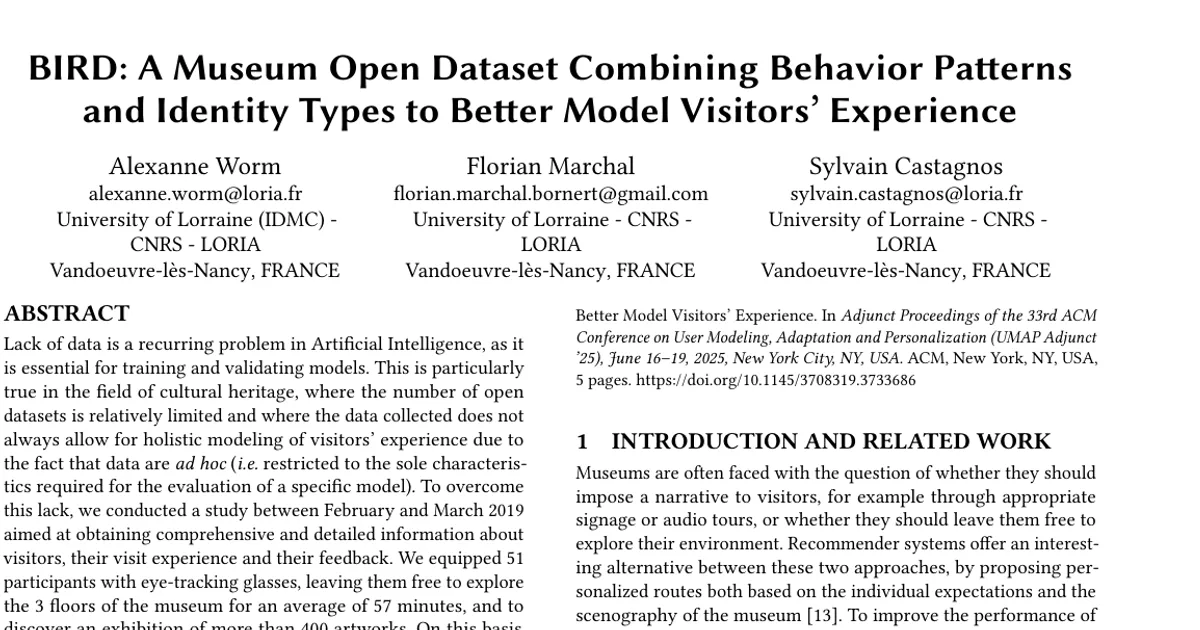
Lack of data is a recurring problem in Artificial Intelligence, as it is essential for training and validating models. This is particularly true in the field of cultural heritage, where the number of open datasets is relatively limited and where the data collected does not always allow for holistic modeling of visitors' experience due to the fact that data are ad hoc (i.e. restricted to the sole characteristics required for the evaluation of a specific model). To overcome this lack, we conducted a study between February and March 2019 aimed at obtaining comprehensive and detailed information about visitors, their visit experience and their feedback. We equipped 51 participants with eye-tracking glasses, leaving them free to explore the 3 floors of the museum for an average of 57 minutes, and to discover an exhibition of more than 400 artworks. On this basis, we built an open dataset combining contextual data (demographic data, preferences, visiting habits, motivations, social context. . . ), behavioral data (spatiotemporal trajectories, gaze data) and feedback (satisfaction, fatigue, liked artworks, verbatim. . . ). Our analysis made it possible to re-enact visitor identities combining the majority of characteristics found in the literature and to reproduce the Veron and Levasseur profiles. This dataset will ultimately make it possible to improve the quality of recommended paths in museums by personalizing the number of points of interest (POIs), the time spent at these different POIs, and the amount of information to be provided to each visitor based on their level of interest.