Research
Benchmarking Multimodal Large Language Models for Scientific Visualization Literacy
Overview Research area: Multimodal large language models (MLLMs) evaluated on scientific visualization (SciVis) literacy, positioned against prior chart-centric (InfoVis) benchmarks. Technical level:
- arXiv
- 2607.15176
- Published
- 2026-07-16
- Authors
- Patrick Phuoc Do, Chau M. Ta, Chaoli Wang
AI summary
Overview
Research area: Multimodal large language models (MLLMs) evaluated on scientific visualization (SciVis) literacy, positioned against prior chart-centric (InfoVis) benchmarks.
Technical level: Intermediate. The paper assumes familiarity with multimodal model evaluation, benchmark accuracy reporting, and standard SciVis technique categories, but the methodology itself is straightforward to follow.
Scope: A benchmark study of six MLLMs on the Scientific Visualization Literacy Assessment Test (SVLAT), a 49-item, closed-world instrument covering 18 scientific visualizations and illustrations across 8 SciVis techniques and 11 task types, compared against human data from 485 participants.
What This Paper Is About
Current evaluations of how well multimodal AI systems understand visualizations are built almost entirely around charts and figures from information visualization, and they offer little evidence about whether models can read scientific visualizations with intrinsic spatial, physical, or temporal structure. This paper addresses that gap by benchmarking six MLLMs on SVLAT, a standardized SciVis literacy instrument, under a closed-world protocol that permits only the supplied visualization and caption as evidence. The goal is to determine whether current MLLMs show measurable SciVis literacy, and where, across techniques and task types, their capabilities break down.
Key Contributions
-
A SciVis-native benchmark of MLLM literacy. The authors evaluate six MLLMs (three closed-source, three open-source) on SVLAT's 49 items, giving a technique- and task-level profile of model capability rather than a single aggregate score.
-
Direct comparison against a human baseline. Model accuracies are placed against human performance from the original SVLAT study, established with 485 non-expert participants (246 females; ages 18–65; education from high school to postgraduate).
-
A controlled evaluation protocol plus reliability accounting. All models receive a single standardized instruction prompt, temperature 0, max_tokens 300, structured JSON output, and a "Not sure" option; each evaluation is repeated 10 times with different random seeds and averaged, and model rationales are retained for qualitative analysis.
-
A qualitative taxonomy of recurring failure modes. Through rationale analysis the authors identify fine-grained quantitative misestimation, flow-direction interpretation error in texture-based visualizations, and encoding-mapping error during higher-level SciVis interpretation. Code and model outputs are released at https://github.com/patdmp/mllm-scivis-lit-benchmark.
Main Findings
-
No uniform SciVis literacy. Performance varies substantially across techniques and tasks within and across models, which the authors characterize as "selectively capable rather than broadly SciVis literate."
-
Gemini is the strongest model and beats the human mean. Gemini-3.1-Pro-Preview scores 90.9% on image items, 82.9% on animation items, and 88.6% overall, exceeding human performance of 76.4%, 74.5%, and 75.9% as stated in the text of Section 3.1. Table 1 lists human values of 76.2% (image), 73.9% (animation), and 75.6% (all).
-
The open-source models fall below the human baseline. Qwen3.5-9B is the best of the three at 68.8% overall, followed by InternVL3.5-8B at 64.3% and LLaVA-OneVision-1.5-8B-Instruct at 64.1%.
-
Closed-source mid-tier models land near the human mean. GPT-5.4 reaches 75.1% overall and Claude-Opus-4.6 reaches 75.3% overall, against a human 75.6% in Table 1.
-
Animation items split the field. Gemini leads at 82.9%. GPT, evaluated via frame extraction (1 frame per second) because its API did not support direct video input, matches human level at 73.6% versus 73.9%. Claude scores lowest of all groups at 59.3%. Among open-source models, LLaVA-OneVision (73.6%) and InternVL (72.9%) approach human level and outperform their own static-image results, while Qwen remains at 67.1%.
-
Model performance is far more variable than human performance. Standard deviations across item types range from 3.9 to 11.7 for MLLMs, versus 2.2 to 4.7 for humans.
-
Technique-level profiles are highly uneven. Humans range from 68.9% to 88.8% across techniques, while models fluctuate much more. Gemini records 100.0% on Surface Rendering and Volume Rendering, 95.0% on Mixed Rendering, 95.7% on Scientific Illustration, and 91.8% on Glyph, Mesh, Plot, exceeding human performance on those techniques.
-
Scientific Illustration is the easiest technique for everyone. Human accuracy is 79.5% and all models range from 81.4% to 95.7%.
-
Texture-based and integration-based visualizations expose the clearest gaps. Humans reach 82.0% on Texture-Based Visualization and 88.8% on Integration-Based Visualization. LLaVA-OneVision is the outlier on Texture-Based Visualization at 90.0%, where all other models fall substantially below it. On Integration-Based Visualization, LLaVA-OneVision (82.5%), GPT (80.0%), and Gemini (75%) remain competitive with humans while other models are notably lower.
-
Search and spatial tasks are easiest; quantitative estimation is hardest. Quantitative Estimation–Relative Estimation (Quantitative) is the most difficult task for every category, staying below 50.0% throughout. Human accuracy is 88.1% on Spatial Understanding–Absolute, 87.7% on Spatial Understanding–Intersection, and 85.6% on Search–Counting. Gemini's main weak points are Pattern Recognition–Repetition at 50.0% and Quantitative Estimation–Relative Estimation (Quantitative) at 45.0%.
-
Open-source strengths are narrow. Qwen and InternVL exceed human performance only on Search–Presence/Absence and Spatial Understanding–Intersection; LLaVA-OneVision exceeds humans only on Spatial Understanding–Intersection. On all remaining tasks these models perform at or below human level.
-
Claude's weakness is concentrated in animation. It scores 81.7% on image items, second only to Gemini, but 59.3% on animation items.
-
Fine-grained quantitative misestimation is a recurring failure. On Item 3, Gemini correctly identified the map's 40-foot contour interval and placed waypoint D between the 6880 ft and 6840 ft contour lines, but claimed waypoint A lay exactly on the 7200 index contour, when A actually lies between the 7200 ft and 7240 ft contours. On Item 41 (lipid envelope radius), Gemini estimated the diameter as approximately five times the scale bar, yielding a 50 nm radius; Claude produced the same overestimate in 10 of 10 runs and GPT in 3 of 10 runs, while open-source models produced 30 to 50 nm across runs. The correct diameter is approximately four times the 20 nm scale bar, giving a radius of about 40 nm.
-
Flow-direction interpretation fails on dense texture-based motion. On Item 20, Gemini and Qwen wrongly concluded winds near Chicago and Houston differ, citing "west to east" for Chicago and "south to north" for Houston, when both flow roughly northwest to southeast. InternVL identified the same direction at both cities but misread it as "west to east," and LLaVA avoided a specific direction, saying only that arrows "point in a similar direction." Most models correctly identified the hurricane's direction in Item 9, so the authors attribute the difficulty to dense texture-based motion decoding rather than directional reasoning in general.
-
Higher-level interpretation can be grounded in unsupported encodings. On Item 35, Gemini inferred fiber density from opacity and solidness and chose region C as densest because it appeared as a "highly opaque, solid red mass." Claude reached the same wrong answer in all 10 runs by invoking neuroanatomical prior knowledge about the splenium of the corpus callosum and color variety, even though the caption specifies that color encodes fiber orientation.
Methodology in Plain English
The researchers took an existing, psychometrically grounded SciVis literacy test, SVLAT, and administered it to AI models instead of people. SVLAT has 49 multiple-choice-style items built on 18 scientific visualizations and illustrations, mixing static images and animations, and it is designed as a closed-world test: every item is answerable using only the visualization and its caption, which limits how much a model can lean on outside knowledge.
Six models were tested: closed-source GPT-5.4, Claude-Opus-4.6, and Gemini-3.1-Pro-Preview (all through the OpenRouter API for consistent deployment), and open-source Qwen3.5-9B, InternVL3.5-8B, and LLaVA-OneVision-1.5-8B-Instruct. Because GPT's and Claude's APIs did not support direct video input at the time, their animation items were handled by extracting one frame per second.
Every model received the same instruction prompt, which casts the model as a SciVis expert, restricts it to the provided visualization and caption, and requires a structured JSON reply with the chosen option, the full answer text, and a short rationale. A "Not sure" option is offered to discourage guessing. Generation used temperature 0 and max_tokens 300. Questions were presented one at a time, each model ran each item 10 times with different random seeds, and results were averaged to blunt residual nondeterminism. Accuracy was then broken out by SciVis technique and by task type, and model rationales were read qualitatively to characterize how models reasoned and where they went wrong.
Why This Matters
Impact on research. The paper argues that SciVis literacy is a missing benchmark dimension for multimodal AI systems. Existing evaluations such as FigureQA, DVQA, PlotQA, ChartQA, CharXiv, MultiChartQA, and SPIQA concentrate on charts, plots, and document figures, and prior visualization-community studies of models on visualization literacy have likewise used InfoVis-style material. By showing that strong chart performance does not translate into uniform SciVis competence, the work gives future model assessment a concrete new target and an instrument (with code and outputs released) for measuring it.
Real-world applications.
- Scientific communication tools that help non-experts read simulation output, medical imaging, and climate visualizations.
- Visual analytics and model-assisted workflows where a model interprets volume, flow, or fiber-field renderings for an analyst.
- Educational platforms that assess or tutor SciVis interpretation skills using standardized items.
- Human–AI interaction design for scientific visual content, where users need to know when a model's reading of a visualization can be trusted.
Industry relevance. The results give practitioners a realistic picture of where to deploy MLLMs and where not to. Models are comparatively reliable on scientific illustrations, search tasks, and spatial understanding, and clearly weak on quantitative estimation, texture-based flow decoding, and integration-based visualizations. With the strongest closed-source model at 88.6% overall and the best open-source model at 68.8% (below the 75.6% human figure in Table 1), the paper indicates that lightweight open-weight models are not yet substitutes for humans on SciVis reading tasks.
Future Directions
- Extend to larger and more diverse models. The open-source comparison is limited to lightweight models, so the authors call for evaluation of a broader model range.
- Broaden prompting and tool-use settings. The current study uses a single standardized prompt; richer prompting and tool-augmented setups remain untested, and prior work on structured prompting suggests measured capability is protocol-dependent.
- Add further SciVis-native evaluation instruments. SVLAT is a single benchmark, and the authors want additional SciVis-specific assessments to complement it.
- Address thin item coverage. Quantitative Estimation–Relative Estimation (Quantitative), Spatial Understanding–Intersection, and Pattern Recognition–Repetition are each represented by only one or two items, so those per-task findings are preliminary and per-task estimates are less reliable. Related open questions include whether animation evaluation via frame extraction systematically understates some models, since GPT and Claude could not receive direct video input.
Target Audience
Researchers and practitioners working on multimodal LLM evaluation, visualization literacy, and visual analytics; SciVis and InfoVis researchers interested in how AI systems read scientific visual representations; psychometricians and HCI researchers building or adapting standardized visualization assessments; and applied teams deciding whether an MLLM can be trusted to interpret scientific imagery, simulation output, or medical and geospatial visualizations in a product or workflow.
Authors’ abstract
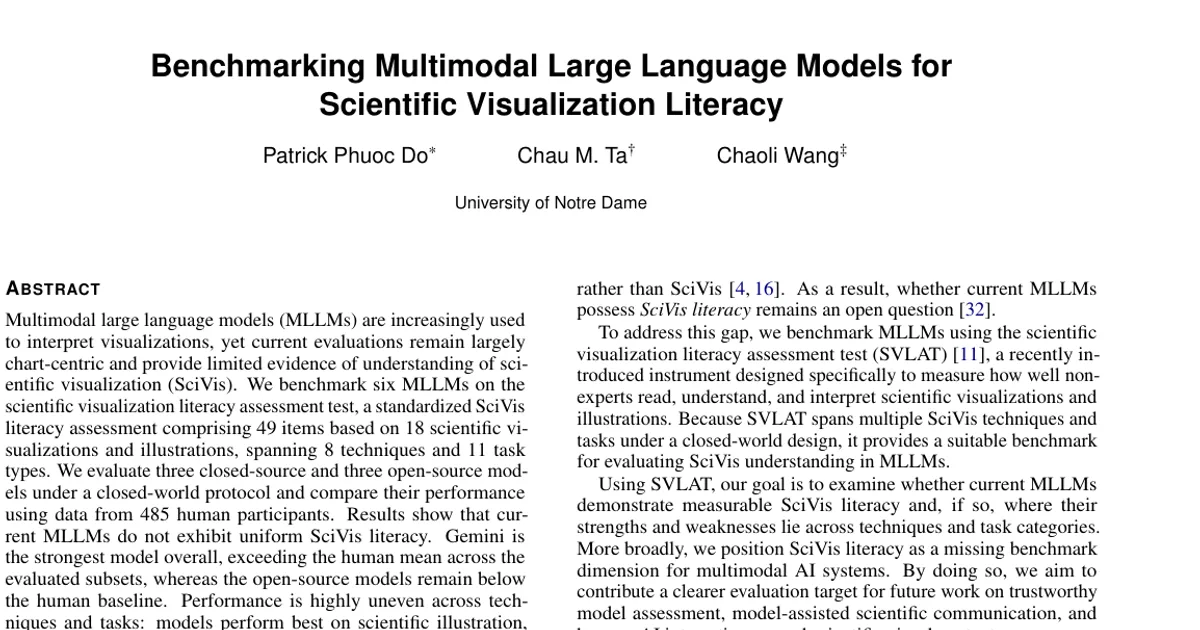
Multimodal large language models (MLLMs) are increasingly used to interpret visualizations, yet current evaluations remain largely chart-centric and provide limited evidence of understanding of scientific visualization (SciVis). We benchmark six MLLMs on the scientific visualization literacy assessment test, a standardized SciVis literacy assessment comprising 49 items based on 18 scientific visualizations and illustrations, spanning 8 techniques and 11 task types. We evaluate three closed-source and three open-source models under a closed-world protocol and compare their performance using data from 485 human participants. Results show that current MLLMs do not exhibit uniform SciVis literacy. Gemini is the strongest model overall, exceeding the human mean across the evaluated subsets, whereas the open-source models remain below the human baseline. Performance is highly uneven across techniques and tasks: models perform best on scientific illustration, search, and spatial understanding, but struggle on texture-based and integration-based visualizations and on quantitative estimation. Error analysis reveals recurring failures in fine-grained quantitative estimation, flow-direction interpretation, and grounded encoding interpretation. These findings position SciVis literacy as a necessary benchmark dimension for evaluating multimodal AI systems. Our code and model outputs are publicly available at https://github.com/patdmp/mllm-scivis-lit-benchmark.