The Pulse
Google DeepMind Maps Six Forest Types at 10-Meter Resolution
Google DeepMind and research partners released a global map classifying forest types and other land uses in 10-meter squares. The ForTy dataset maps a 2020 baseline and includes an early annual series covering 2017 through 2025.
AI.info Team · Written with AI · fact-checked ·
ForTy classifies forest type across six categories with 90.2% overall accuracy, according to its independent assessment. Google DeepMind, Google Research, the World Resources Institute and the International Institute for Applied Systems Analysis released the 10-meter-resolution map on October 22, aiming to show not just where trees stand but what kind of forest or land use occupies each mapped patch.
Six classes beyond tree cover
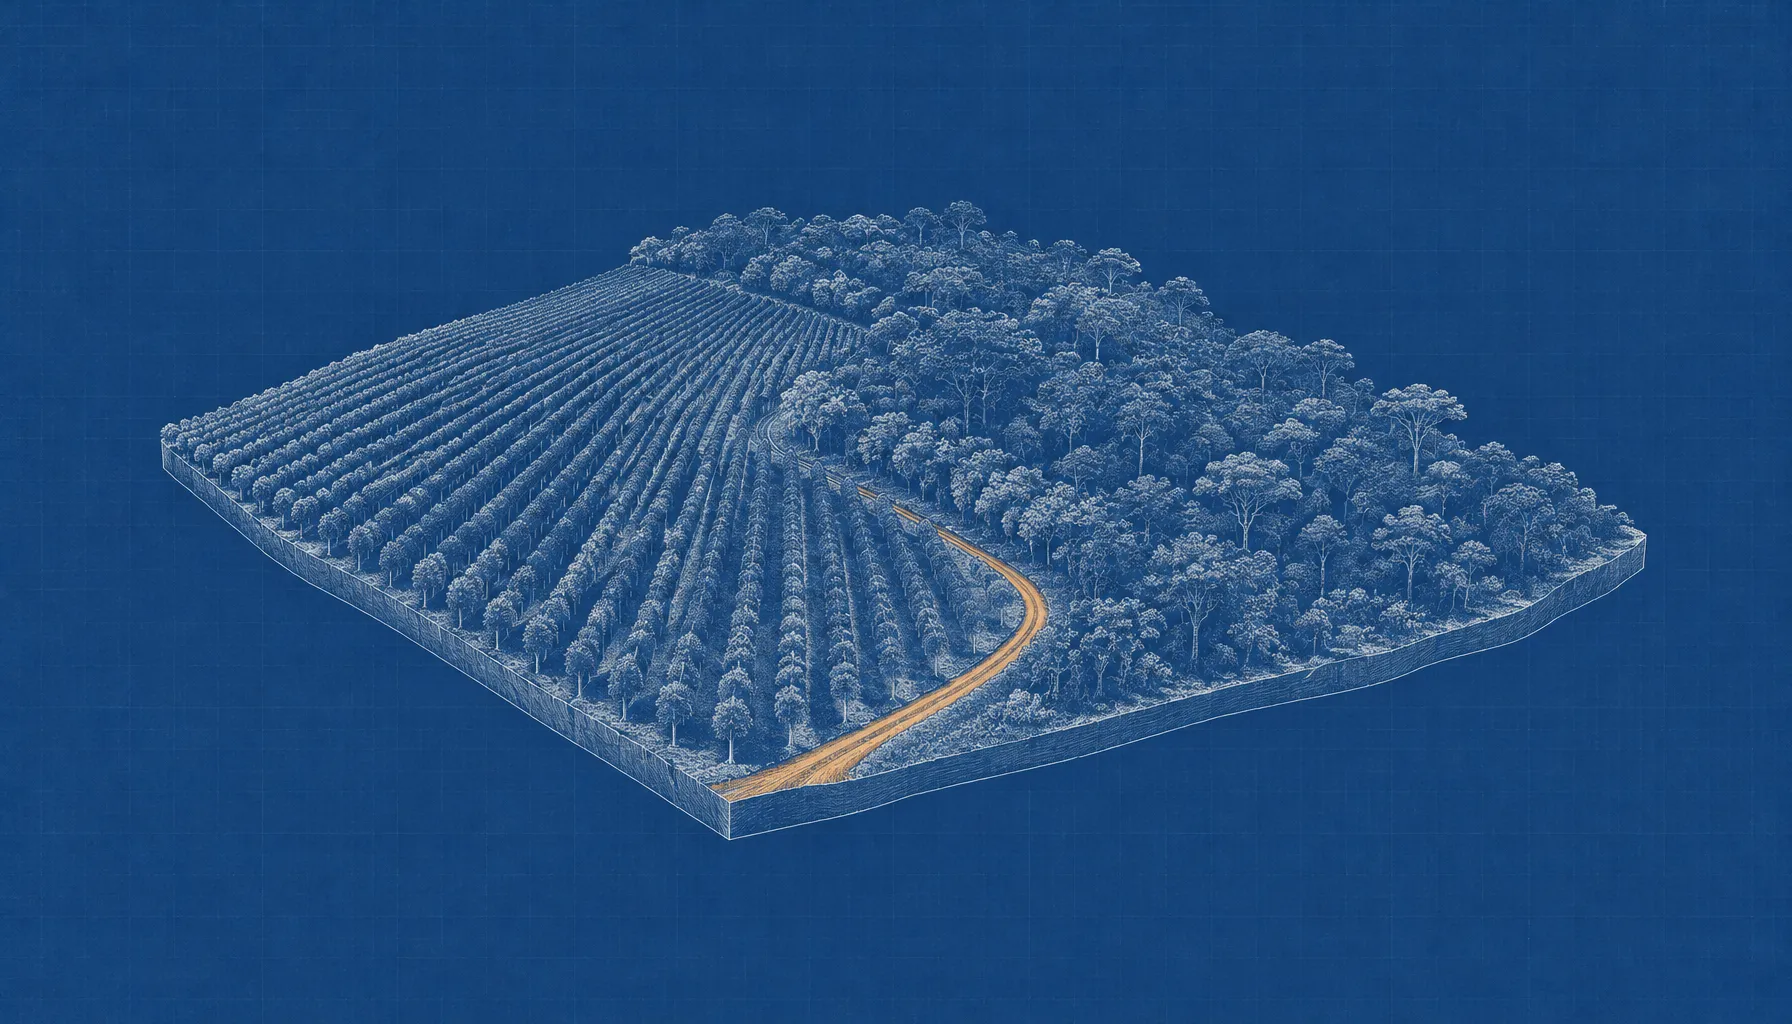
The Forest Typology, or ForTy, assigns land to primary forest, naturally regenerating forest, planted forest, plantation forest, tree crops and agroforestry, or other land. The categories follow definitions aligned with the UN Food and Agriculture Organization and the European Union’s deforestation-free products regulation. The distinction matters because a mature natural forest, a managed timber plantation and an oil-palm farm can all look like green tree cover in a conventional satellite map, while differing in land use and ecological value.
ForTy’s 2020 baseline covers land between 65 degrees south and 84 degrees north. Its underlying dataset supplies per-class relative confidence scores at 10-meter resolution, rather than forcing users to rely only on one hard category per pixel. The files are available through Google Earth Engine and as downloadable geospatial data under a Creative Commons Attribution 4.0 license.
Why the authors use satellite histories
Forest type is partly a question of land-use history, not simply the appearance of a canopy in a single image. The researchers trained the model on about 1.7 million labeled locations assembled from expert surveys, national and regional datasets, and targeted reviews of locations where predictions proved difficult. ForTy uses AlphaEarth Foundations embeddings—compact summaries of satellite observations over time—to detect cues such as planting patterns, seasonal growth and harvest cycles.
“Rather than hard categorical labels, the dataset distributes per-class relative confidence scores, enabling users to adapt the classification to regional contexts and application-specific precision–recall trade-offs.”
Maxim Neumann et al., Scientific Data
The confidence values can help analysts set different thresholds for different tasks, but they are not calibrated probabilities of a class being true. The paper advises users to examine scores in their own areas and, where needed, choose thresholds using local validation data. That caveat matters for organizations considering the map in regulatory or supply-chain assessments: a global map can guide scrutiny, but local conditions still shape how its scores should be interpreted.
What the validation measured
The team assessed the map using a globally stratified sample of 9,100 sites. Two trained experts reviewed high-resolution imagery and satellite records at each site; 8,190 sites had been fully resolved through expert consensus and were used for accuracy estimates. The six-class classification reached 90.2% overall accuracy, while the paper reports 94.8% for distinguishing natural forest from non-natural forest and 95.5% for forest versus non-forest.
Those figures describe different classification tasks, not interchangeable measures of performance. The broad forest/non-forest distinction is simpler than identifying which of six forest and land-use classes occupies a pixel. Google’s announcement rounds the forest-versus-non-forest result to 95% and says the map outperforms other global forest maps.
A yearly view of change, not just loss
Alongside the 2020 map, the researchers released an early annual series spanning 2017 to 2025. It is designed to show what follows forest loss as well as where loss occurs: natural forest may become a timber plantation, while abandoned land may gradually return to forest. A standard tree-cover map can miss the first transition when replanted trees restore a green canopy; the ForTy series attempts to classify the replacement land use.
The map is intended to support conservation planning, forest monitoring and checks tied to deforestation-free supply chains. It is a research dataset, not a consumer Google Maps layer, and its confidence scores leave users with a practical task: decide what level of certainty is appropriate for the particular region and decision at hand.