Implementation Guides
Implementing Real-Time ML Inference
How to build low-latency ML inference systems that serve predictions in milliseconds. Covers model optimization, serving architectures, caching, and performance tuning.

Gabriele Masetti ·
Start from the latency budget, not the model
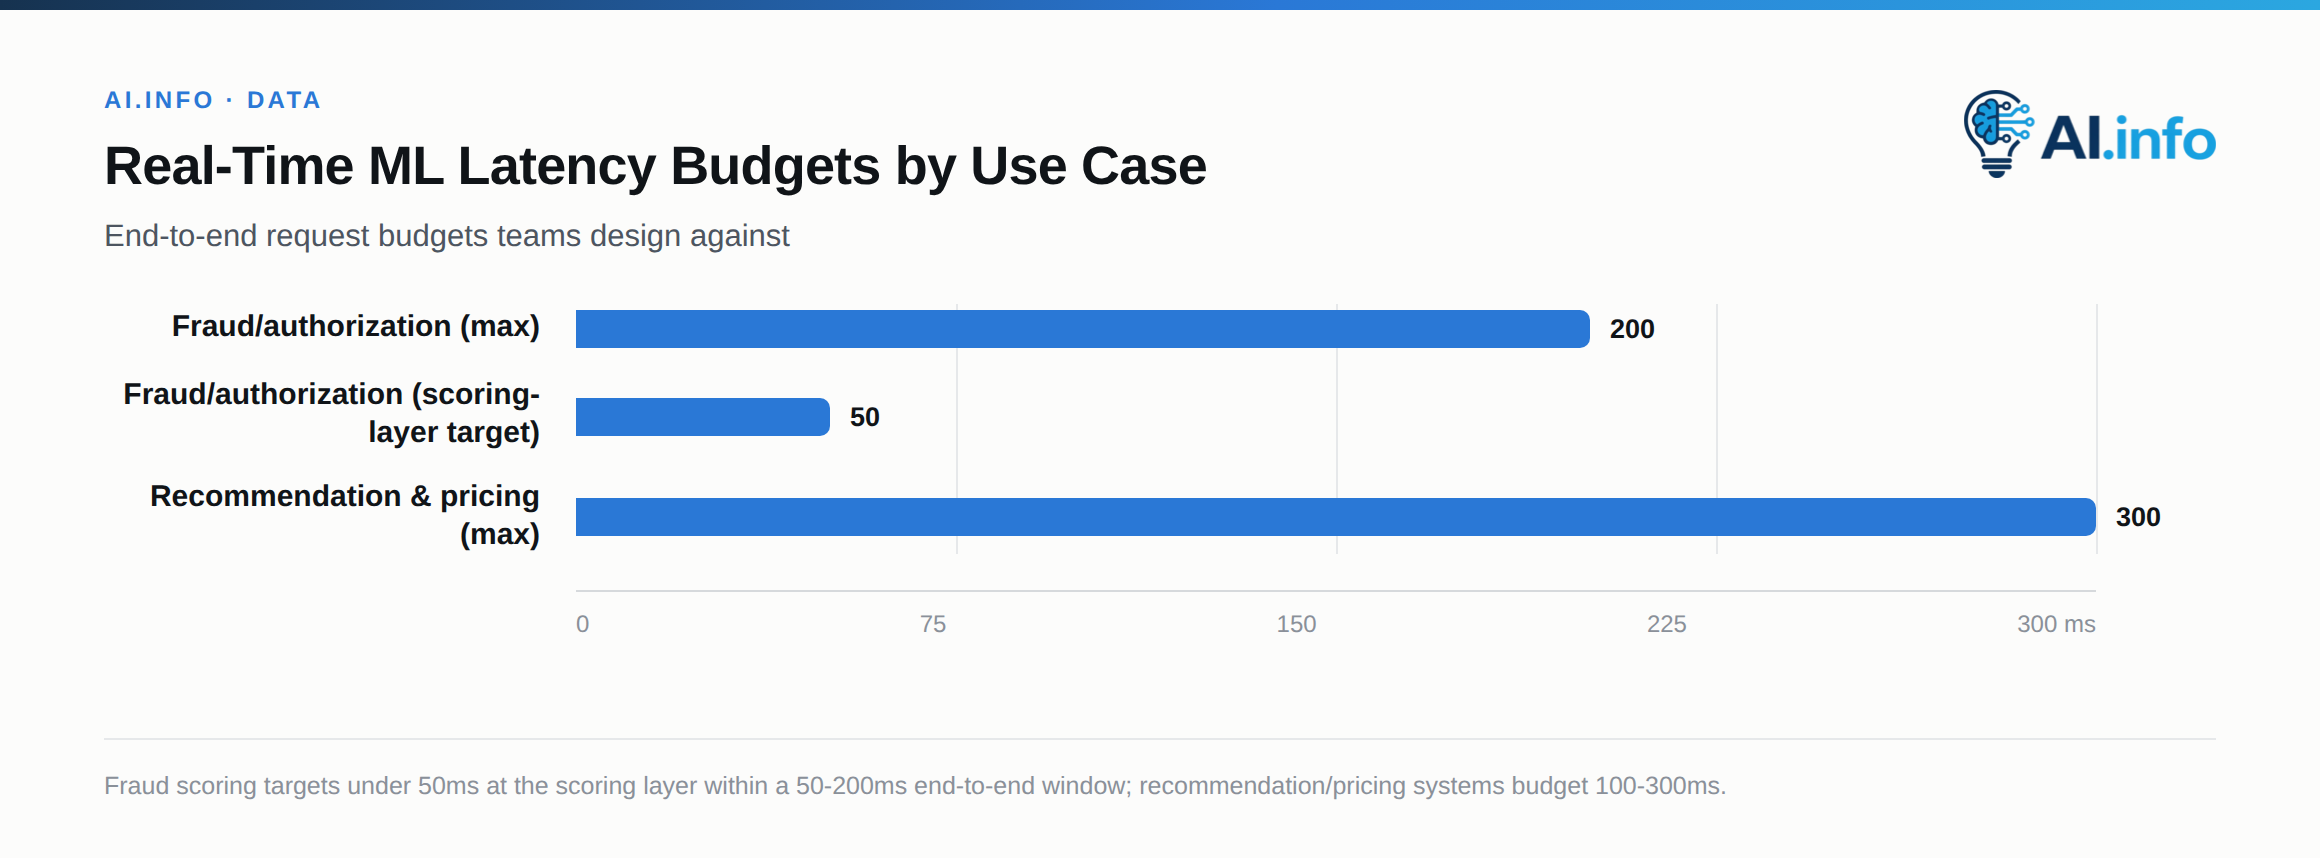
Real-time ML inference is a systems problem wearing a modeling costume. Before touching a framework, decompose the SLA into a budget across every hop the request takes. For fraud scoring and similar authorization-path use cases, the end-to-end decision window is typically 50-200ms, and mature teams target under 50ms at the scoring layer itself, leaving headroom for network transit, feature enrichment, and downstream action logic.
Recommendation and pricing systems are usually more forgiving (100-300ms end-to-end), but the budgeting discipline is identical: write down milliseconds for network, feature retrieval, preprocessing, model forward pass, postprocessing, and serialization, and treat each line item as a design constraint, not an afterthought.
The failure mode to design against is tail latency, not average latency. A model that averages 8ms but spikes to 400ms under load will violate SLAs constantly, because a single user-facing request often fans out to multiple model calls — any one of which can be the slow one. Optimize and monitor p99 (and often p99.9), not mean or p50.
Feature freshness: the online feature store
For fraud, recommendation, and pricing models, most of the signal comes from features computed elsewhere (aggregates, embeddings, counters) and joined at request time — not from the raw payload alone. The feature store, not the model, is frequently the bottleneck as a result. Infrastructure has to deliver features within single-digit milliseconds to leave any budget for the model at all; if feature retrieval eats the budget, teams are forced into simpler models, which directly increases missed detections or worse recommendations.
Feast is the dominant open-source feature store for this pattern. Its architecture splits cleanly:
- Offline store (BigQuery, Snowflake, Parquet on S3) for training-time historical feature retrieval.
- Online store (Redis, DynamoDB, or SQLite for dev) for low-latency point-in-time lookups at inference.
- A materialization/push job that keeps the online store in sync with computed feature values, so serving never recomputes aggregates on the request path.
Store choice matters more than most teams expect. Feast benchmarks found Redis performing 4-10x better than other online store backends, with one Redis Enterprise cluster benchmark hitting p99 of 4.2ms for feature retrieval at 2.5M queries/sec using the Java gRPC serving path. DynamoDB is a reasonable managed alternative when you want to avoid operating Redis, but expect it to trail Redis on tail latency. AWS also documents ElastiCache for Redis specifically as an "ultra-low-latency online feature store" pattern for this exact use case.
| Store | Metric | Value |
|---|---|---|
| Redis Enterprise | p99 feature retrieval latency | 4.2ms |
| Redis Enterprise | Throughput | 2.5M queries/sec |
| Redis (relative) | vs other online store backends | 4-10x better |
Practical rules:
- Precompute and materialize aggregates (rolling counts, embeddings, velocity features) on a schedule or via streaming — never compute them synchronously in the request path.
- Colocate the online store with the serving tier to avoid cross-AZ hops; a few hundred microseconds of network latency compounds across dozens of feature lookups.
- Use a single batched multi-get for all features a request needs rather than N sequential calls.
Model serving frameworks
Three tools now carry most self-hosted real-time serving; pick based on framework diversity, hardware target, and team size. A fourth used to be on this list and has since dropped off it.
NVIDIA Triton Inference Server is the default choice when you need GPU efficiency across multiple frameworks (ONNX, TensorRT, PyTorch, TensorFlow, even Python custom backends) behind one server. Its two headline features for real-time workloads:
- Dynamic batching — Triton queues incoming requests for a configurable
max_queue_delay_microsecondsand merges them into batches up topreferred_batch_size, trading a small added wait for dramatically better GPU utilization. Documented results show dynamic batching cutting p99 latency by 47% (445ms to 234ms at 8 concurrent requests) while lifting throughput 3.5x and GPU utilization from 18% to 72%. The tuning knob is the queue delay: too large and you blow your latency budget, too small and batches never fill.
| Metric (8 concurrent requests) | Before | After |
|---|---|---|
| p99 latency | 445ms | 234ms |
| GPU utilization | 18% | 72% |
| Throughput | baseline | 3.5x |
- Concurrent model execution — multiple model instances (or multiple copies of the same model) run in parallel on the same GPU via CUDA streams, so one slow model doesn't head-of-line block others.
TorchServe is no longer a choice. The official PyTorch serving tool had carried a limited-maintenance notice since 2024, and the pytorch/serve repository was archived on 7 August 2025: read-only, with no planned updates, bug fixes, new features or security patches, and an explicit warning that vulnerabilities may not be addressed.
Existing releases still install and still serve traffic, so the question for a team running TorchServe today is not whether it works but who patches it when a CVE lands in one of its dependencies. Treat it as a migration target with a deadline, not a default. The usual exits are Triton's PyTorch backend for GPU fleets that already need multi-framework support, and BentoML for teams that want a smaller operational surface than Triton.
BentoML targets developer velocity, and is the most common landing spot for PyTorch-only teams leaving TorchServe: package a model plus preprocessing code as a "Bento," deploy as a container or to a managed platform, and get adaptive batching for free. Reported benchmarks show BentoML sustaining 1000+ requests/sec with p95 under 50ms on a ResNet50-class workload on modest hardware — good enough for most non-LLM real-time services, and a much shorter path to production for small teams than standing up Triton.
Ray Serve is the right tool when the "model" is actually a pipeline — feature transform, retrieval, ranking model, business-rule postprocessing — spread across multiple deployments that need independent scaling. Ray Serve deployments run as Ray actors, and its autoscaler adjusts replica count based on the average number of ongoing requests per replica versus a configured target_ongoing_requests, with min_replicas/max_replicas bounds. For multi-model composition, each deployment in the chain typically has different latency and concurrency characteristics, so autoscaling parameters need to be tuned per deployment rather than globally.
# Ray Serve: two-stage pipeline, each deployment autoscales independently
from ray import serve

@serve.deployment(
    autoscaling_config={
        "min_replicas": 2,
        "max_replicas": 20,
        "target_ongoing_requests": 4,
    }
)
class FeatureEnricher:
    async def __call__(self, request):
        ...  # feature-store lookups

@serve.deployment(
    autoscaling_config={"min_replicas": 4, "max_replicas": 50, "target_ongoing_requests": 2},
    ray_actor_options={"num_gpus": 0.25},
)
class Scorer:
    async def __call__(self, features):
        ...  # model.forward()
Compiling and quantizing the model
Before scaling out replicas, shrink the per-request cost. Two levers, usually stacked:
ONNX export + ONNX Runtime decouples the serving format from the training framework and enables graph-level optimizations (operator fusion, constant folding) independent of hardware backend.
TensorRT (directly, or as an ONNX Runtime execution provider) compiles the graph into a hardware-specific engine. Reported speedups vary widely by architecture but are consistently large: INT8 TensorRT engines have been measured at roughly 3.7x faster than FP32 for ResNet50-class CNNs, and INT8 quantization generally lands in the 2-4x range with minimal accuracy loss when calibrated properly. Getting the Tensor Core speedup requires INT8-capable hardware — every NVIDIA data-centre part since Turing qualifies, from the T4 through Hopper and Blackwell — and requires a calibration step (representative data run through the FP32 model to compute quantization scales) before deployment — skipping calibration and just casting weights will silently degrade accuracy.
Current accelerators have moved the floor below INT8. Hopper's fourth-generation Tensor Cores (H100, H200) introduced FP8; Blackwell's fifth generation (B200, B300) adds FP4, which Hopper does not support. On hardware bought in the last two years the question is which sub-8-bit format to calibrate for, not whether to quantize at all. The calibration discipline is unchanged.
Practical sequencing: export to ONNX first and validate numerical parity against the training-framework model on a held-out set, then quantize and validate parity again before touching TensorRT — each step is a separate place accuracy can regress, and debugging a combined export-plus-quantize failure is much harder than debugging one at a time.
Caching, batching, and shedding load
Three cheap wins before reaching for more hardware:
- Request-level caching. If the same (user, item) or transaction pattern scores repeatedly within a short window, cache the score with a short TTL (seconds, not minutes, for fraud/pricing where staleness has a cost). Caching scores is the single highest-leverage optimization for recommendation re-ranking, where the candidate set barely changes request to request.
- Feature caching separate from prediction caching. Even when the final prediction can't be cached (different candidates each call), the underlying user/item features usually can be, cutting feature-store round trips.
- Adaptive/dynamic batching at the server, as described above for Triton and BentoML — this is the mechanism that lets you buy GPU throughput without buying more GPUs, at the cost of a few milliseconds of queuing delay.
- Load shedding and timeouts. Every real-time path needs an explicit fallback: a fast heuristic or a cached last-known-good score returned when the primary model can't respond inside its slice of the budget. Silently blocking until the model responds is how one slow dependency turns into a full outage.
Autoscaling and capacity for spiky traffic
Real-time ML traffic is bursty by nature (flash sales, fraud rings testing cards in waves, breaking-news-driven recommendation spikes), so autoscaling on CPU/GPU utilization alone reacts too late — utilization only rises after the queue has already backed up. Prefer autoscaling on a leading indicator:
- Ray Serve autoscales on ongoing-requests-per-replica, a queue-depth proxy, rather than raw utilization.
- For Triton behind Kubernetes, scale on request queue time or GPU utilization exported via Prometheus/DCGM, with a floor of warm replicas sized to absorb the time-to-scale (container start plus model load) without breaching SLA.
- Keep minimum replica counts high enough to survive the scale-up lag — GPU-backed pods with multi-gigabyte model weights can take tens of seconds to become ready, which is an eternity relative to a 100ms SLA.
Rollout safety: shadow and canary
Never point 100% of production traffic at a newly deployed model. Two complementary patterns:
- Shadow (dark) traffic — mirror live requests to the new model, log its predictions, but serve responses from the current production model. Shadowing validates latency and output distribution under real load with zero user-facing risk, and is the only way to catch feature-store drift or serialization bugs that unit tests miss.
- Canary release — route a small percentage (1-5%) of live traffic to the new model version and compare business metrics (approval rate, click-through, fraud catch rate) and latency percentiles against the incumbent before ramping. Both Triton (via model version policies) and Kubernetes-native tools such as KServe or Seldon Core support traffic-split canarying.
Monitoring what actually matters
Instrument every hop separately, not just the outer request:
- p50/p95/p99/p99.9 latency broken out by stage: feature retrieval, preprocessing, model forward pass, postprocessing.
- GPU/accelerator utilization and queue depth (Triton and Ray Serve both expose Prometheus metrics natively).
- Prediction distribution drift — a model returning a suspiciously narrow score band is often the first sign of a stale or broken feature pipeline, well before accuracy metrics catch it.
- Feature staleness — age of the most recent write per feature key in the online store; a growing staleness metric means the materialization job is falling behind, and every downstream score is quietly using yesterday's data.
Common mistakes worth naming
- Recomputing aggregate features synchronously on the request path. If a "real-time" feature requires scanning recent transactions at inference time, it isn't a feature store, it's a database query wearing a feature store's name — and it will dominate your latency budget the moment volume grows.
- Batching by default when the workload is single-request, latency-critical traffic. Dynamic batching helps throughput-bound GPU workloads; for a strict 20ms budget with low concurrency, a few milliseconds of queuing delay may cost more than it saves. Measure before enabling.
- Treating quantization as free. INT8 without calibration, or calibrated on non-representative data, silently degrades tail-case accuracy (rare fraud patterns, cold-start items) exactly where it matters most — validate on a held-out set that includes rare classes, not just aggregate accuracy.
- No fallback path. Every real-time model needs a documented, tested behavior for "the model didn't respond in time" that isn't "block the user request."